 RSS Feed
 by Calculated Risk on 9/20/2021 11:26:00 AM
Monday, September 20, 2021
Housing Inventory Sept 20th Update: Inventory Up 1.2% Week-over-week, Up 42% from Low in early April
Tracking existing home inventory will be very important this year.
 Click on graph for larger image in graph gallery.
This inventory graph is courtesy of Altos Research.
As of September 17th, inventory was at 436 thousand (7 day average), compared to 573 thousand for the same week a year ago. That is a decline of 23.8%.
Compared to the same week in 2019, inventory is down 55%.
A week ago, inventory was at 431 thousand, and was down 25.5% YoY. Two weeks ago inventory was at 437 thousand (the peak for the year so far).
Seasonally, inventory has bottomed, but may be peaking for the year. Inventory was about 42.4% above the record low in early April.
A couple of interesting points from 2019: In 2019, inventory bottomed at 814 thousand in February (so inventory is still very low compared to normal levels). And, in 2019, inventory peaked at 972 thousand in early August (an increase of 158 thousand, or about 19% from the low). So inventory is less than half of what we'd normally expect, however inventory has increased 130 thousand (almost normal).
Key question: Usually inventory peaks in the Summer, and then declines into the Fall. Will inventory follow the normal seasonal pattern, or will inventory continue to increase over the coming months? This will be important to watch for house prices and housing activity.
Mike Simonsen discusses this data regularly on Youtube.
Altos Research has also seen a significant pickup in price decreases - now well above the level of a year ago - but still below a normal rate for August.
NAHB: Builder Confidence Increased to 76 in September
by Calculated Risk on 9/20/2021 10:04:00 AM
The National Association of Home Builders (NAHB) reported the housing market index (HMI) was at 76, up from 75 in August. Any number above 50 indicates that more builders view sales conditions as good than poor.
From the NAHB: Builder Confidence Steadies as Material and Labor Challenges Persist
Builder confidence inched up in September on lower lumber prices and strong housing demand, even as the housing sector continues to grapple with building material supply chain issues and labor challenges. Ending a three-month decline, builder sentiment in the market for newly built single-family homes edged up one point to 76 in September, according to the NAHB/Wells Fargo Housing Market Index (HMI) released today.
“Builder sentiment has been gradually cooling since the HMI hit an all-time high reading of 90 last November,” said NAHB Chairman Chuck Fowke. “The September data show stability as some building material cost challenges ease, particularly for softwood lumber. However, delivery times remain extended and the chronic construction labor shortage is expected to persist as the overall labor market recovers.”
“The single-family building market has moved off the unsustainably hot pace of construction of last fall and has reached a still hot but more stable level of activity, as reflected in the September HMI,” said NAHB Chief Economist Robert Dietz. “While building material challenges persist, the rate of cost growth has eased for some products, but the job openings rate in construction is trending higher.”
...
The HMI index gauging current sales conditions rose one point to 82, the component measuring traffic of prospective buyers posted a two-point gain to 61 and the gauge charting sales expectations in the next six months held steady at 81.
Looking at the three-month moving averages for regional HMI scores, the Northeast fell two points to 72, the South dropped two points to 80 and the West registered a two-point decline to 83. The Midwest remained unchanged at 68.
 Click on graph for larger image.
This graph show the NAHB index since Jan 1985.
This was above the consensus forecast, and a solid reading.
Seven High Frequency Indicators for the Economy
by Calculated Risk on 9/20/2021 08:35:00 AM
These indicators are mostly for travel and entertainment. It will interesting to watch these sectors recover as the pandemic subsides.
The TSA is providing daily travel numbers.
This data is as of September 19th.
 Click on graph for larger image.
This data shows the 7-day average of daily total traveler throughput from the TSA for 2019 (Light Blue), 2020 (Blue) and 2021 (Red).
The dashed line is the percent of 2019 for the seven day average.
The 7-day average is down 26.8% from the same day in 2019 (73.2% of 2019). (Dashed line)
Note that the dashed line hit a pandemic high over the Labor Day weekend - probably due to leisure travel, but is now below pre-holiday levels.
The red line would usually start increasing seasonally after Labor Day. But it appears business traffic is still soft.
The second graph shows the 7-day average of the year-over-year change in diners as tabulated by OpenTable for the US and several selected cities.
IMPORTANT: OpenTable notes: "we’ve updated the data including downloadable dataset from January 1, 2021 onward to compare seated diners from 2021 to 2019, as opposed to year over year." Thanks!
 Thanks to OpenTable for providing this restaurant data:
This data is updated through September 18, 2021.
This data is "a sample of restaurants on the OpenTable network across all channels: online reservations, phone reservations, and walk-ins. For year-over-year comparisons by day, we compare to the same day of the week from the same week in the previous year."
Note that this data is for "only the restaurants that have chosen to reopen in a given market". Since some restaurants have not reopened, the actual year-over-year decline is worse than shown.
Dining picked up for the Labor Day weekend, but declined after the holiday. The 7-day average for the US is down 13% compared to 2019.
----- Movie Tickets: Box Office Mojo -----
 This data shows domestic box office for each week and the median for the years 2016 through 2019 (dashed light blue).
 Thanks to OpenTable for providing this restaurant data:
This data is updated through September 18, 2021.
This data is "a sample of restaurants on the OpenTable network across all channels: online reservations, phone reservations, and walk-ins. For year-over-year comparisons by day, we compare to the same day of the week from the same week in the previous year."
Note that this data is for "only the restaurants that have chosen to reopen in a given market". Since some restaurants have not reopened, the actual year-over-year decline is worse than shown.
Dining picked up for the Labor Day weekend, but declined after the holiday. The 7-day average for the US is down 13% compared to 2019.
 This data shows domestic box office for each week and the median for the years 2016 through 2019 (dashed light blue).
 Blue is 2020 and Red is 2021.
The data is from BoxOfficeMojo through September 16th.
Note that the data is usually noisy week-to-week and depends on when blockbusters are released.
Movie ticket sales were at $80 million last week, down only about 46% from the median for the week.
Note that the data is usually noisy week-to-week and depends on when blockbusters are released.
Movie ticket sales were at $80 million last week, down only about 46% from the median for the week.
 This graph shows the seasonal pattern for the hotel occupancy rate using the four week average.
 The red line is for 2021, black is 2020, blue is the median, dashed purple is 2019, and dashed light blue is for 2009 (the worst year on record for hotels prior to 2020).
This data is through September 11th. The occupancy rate was down 13.6% compared to the same week in 2019. The comparison to 2019 was difficult this week due to the timing of Labor Day. Last week the occupancy rate was unchanged year-over-year. If we average the last two weeks, occupancy is down about 7% compared to the same two weeks in 2019.
Notes: Y-axis doesn't start at zero to better show the seasonal change.
With solid leisure travel, the Summer months had decent occupancy - but it is uncertain what will happen in the Fall with business travel - usually weekly occupancy increases to around 70% in the weeks following Labor Day due to renewed business travel.
----- Gasoline Supplied: Energy Information Administration -----
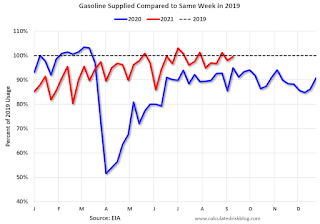 This graph, based on weekly data from the U.S. Energy Information Administration (EIA), shows gasoline supplied compared to the same week of 2019.
Blue is for 2020. Red is for 2021.
As of September 10th, gasoline supplied was down 0.5% compared to the same week in 2019.
There have been five weeks so far this year when gasoline supplied was up compared to the same week in 2019.
----- Transit: Apple Mobility -----
This graph is from Apple mobility. From Apple: "This data is generated by counting the number of requests made to Apple Maps for directions in select countries/regions, sub-regions, and cities." This is just a general guide - people that regularly commute probably don't ask for directions.
There is also some great data on mobility from the Dallas Fed Mobility and Engagement Index. However the index is set "relative to its weekday-specific average over January–February", and is not seasonally adjusted, so we can't tell if an increase in mobility is due to recovery or just the normal increase in the Spring and Summer.
 This data is through September 18th for the United States and several selected cities.
The graph is the running 7-day average to remove the impact of weekends.
IMPORTANT: All data is relative to January 13, 2020. This data is NOT Seasonally Adjusted. People walk and drive more when the weather is nice, so I'm just using the transit data.
According to the Apple data directions requests, public transit in the 7 day average for the US is at 1157 of the January 2020 level.
 This graph, based on weekly data from the U.S. Energy Information Administration (EIA), shows gasoline supplied compared to the same week of 2019.
Blue is for 2020. Red is for 2021.
As of September 10th, gasoline supplied was down 0.5% compared to the same week in 2019.
There have been five weeks so far this year when gasoline supplied was up compared to the same week in 2019.
This graph is from Apple mobility. From Apple: "This data is generated by counting the number of requests made to Apple Maps for directions in select countries/regions, sub-regions, and cities." This is just a general guide - people that regularly commute probably don't ask for directions.
There is also some great data on mobility from the Dallas Fed Mobility and Engagement Index. However the index is set "relative to its weekday-specific average over January–February", and is not seasonally adjusted, so we can't tell if an increase in mobility is due to recovery or just the normal increase in the Spring and Summer.
 This data is through September 18th for the United States and several selected cities.
The graph is the running 7-day average to remove the impact of weekends.
IMPORTANT: All data is relative to January 13, 2020. This data is NOT Seasonally Adjusted. People walk and drive more when the weather is nice, so I'm just using the transit data.
According to the Apple data directions requests, public transit in the 7 day average for the US is at 1157 of the January 2020 level.
New York City is doing well by this metric, but subway usage in NYC is down sharply (next graph).
----- New York City Subway Usage -----
Here is some interesting data on New York subway usage (HT BR).
 This graph is from Todd W Schneider. This is weekly data since 2015.
Here is some interesting data on New York subway usage (HT BR).
 This graph is from Todd W Schneider. This is weekly data since 2015.
 Most weeks are between 30 and 35 million entries, and currently there are over 14 million subway turnstile entries per week - and moving up recently.
This data is through Friday, September 17th.
Schneider has graphs for each borough, and links to all the data sources.
He notes: "Data updates weekly from the MTA’s public turnstile data, usually on Saturday mornings".
This data is through Friday, September 17th.
Schneider has graphs for each borough, and links to all the data sources.
He notes: "Data updates weekly from the MTA’s public turnstile data, usually on Saturday mornings".
Sunday, September 19, 2021
Monday: NAHB Homebuilder Survey
by Calculated Risk on 9/19/2021 07:20:00 PM
Weekend:
• Schedule for Week of September 19, 2021
• FOMC Preview: Tapering "Advance Notice" Likely
Monday:
• 10:00 AM ET, The September NAHB homebuilder survey. The consensus is for a reading of 74, down from 75 in August. Any number above 50 indicates that more builders view sales conditions as good than poor.
From CNBC: Pre-Market Data and Bloomberg futures S&P 500 are down 10 and DOW futures are down 103 (fair value).
Oil prices were up over the last week with WTI futures at $71.78 per barrel and Brent at $75.16 per barrel. A year ago, WTI was at $41, and Brent was at $42 - so WTI oil prices are UP 75% year-over-year (oil prices collapsed at the beginning of the pandemic).
Here is a graph from Gasbuddy.com for nationwide gasoline prices. Nationally prices are at $3.18 per gallon. A year ago prices were at $2.16 per gallon, so gasoline prices are up $1.02 per gallon year-over-year.
FOMC Preview: Tapering "Advance Notice" Likely
by Calculated Risk on 9/19/2021 11:20:00 AM
Expectations are there will be no change to rate policy when the FOMC meets on Tuesday and Wednesday this week. However, there is an expectation that the FOMC will make it clear that they intend to start the tapering of asset purchases soon.
Here are some comments from Goldman Sachs economists on the timing of tapering:
The FOMC is likely to provide the promised “advance notice” that tapering is coming at its September meeting, paving the way to announce the start of tapering at its November meeting. Specifically, we expect the September FOMC statement to say something along the lines of, “The Committee expects to begin reducing the pace of its asset purchases relatively soon, provided that the economy evolves broadly as anticipated.”Analysts will also be looking for comments on inflation, although the Fed is probably not overly concerned with inflation right now. Some of the recent increase in inflation was due to base effects (prices declined at the beginning of the pandemic), and some probably due to transitory effects related to supply bottlenecks. However, the recent surge in COVID cases has probably extended the supply chain disruptions, and there is growing concern that rising rents will spill through to Owners' Equivalent Rent (OER) - a large component of CPI and PCE prices - and push up PCE inflation in 2022.
Updated projections will be released at this meeting. For review, here are the June FOMC projections.
Wall Street forecasts were for GDP to increase at a 8.6% annual rate in Q2 (came in at 6.6%) and forecasts for Q3 have been downgraded recently. So the FOMC GDP projections are now too high and will likely be revised back down to around the March projection range for 2021.
| GDP projections of Federal Reserve Governors and Reserve Bank presidents, Change in Real GDP1 | ||||
|---|---|---|---|---|
| Projection Date | 2021 | 2022 | 2023 | |
| June 2021 | 6.8 to 7.3 | 2.8 to 3.8 | 2.0 to 2.5 | |
| Mar 2021 | 5.8 to 6.6 | 3.0 to 3.8 | 2.0 to 2.5 | |
Note that the unemployment rate doesn't capture the economic damage to the labor market. Not only are there 2.7 million more people currently unemployed than prior to the pandemic, over 2.9 million people have left the labor force since February 2020. And millions more were being supported by various provisions of the disaster relief acts.
Any change to the June unemployment rate projections will probably be minor.
2 Projections for the unemployment rate are for the average civilian unemployment rate in the fourth quarter of the year indicated.
As of July 2021, PCE inflation was up 4.2% from July 2020. Projections for PCE inflation in 2021 will be revised up closer to 4%.
PCE core inflation was up 3.6% in July year-over-year. Core PCE inflation projections for 2021 will also be revised up.
| Unemployment projections of Federal Reserve Governors and Reserve Bank presidents, Unemployment Rate2 | ||||
|---|---|---|---|---|
| Projection Date | 2021 | 2022 | 2023 | |
| June 2021 | 4.4 to 4.8 | 3.5 to 4.0 | 3.2 to 3.8 | |
| Mar 2021 | 4.2 to 4.7 | 3.6 to 4.0 | 3.2 to 3.8 | |
As of July 2021, PCE inflation was up 4.2% from July 2020. Projections for PCE inflation in 2021 will be revised up closer to 4%.
| Inflation projections of Federal Reserve Governors and Reserve Bank presidents, PCE Inflation1 | ||||
|---|---|---|---|---|
| Projection Date | 2021 | 2022 | 2023 | |
| June 2021 | 3.1 to 3.5 | 1.9 to 2.3 | 2.0 to 2.2 | |
| Mar 2021 | 2.2 to 2.4 | 1.8 to 2.1 | 2.0 to 2.2 | |
PCE core inflation was up 3.6% in July year-over-year. Core PCE inflation projections for 2021 will also be revised up.
| Core Inflation projections of Federal Reserve Governors and Reserve Bank presidents, Core Inflation1 | ||||
|---|---|---|---|---|
| Projection Date | 2021 | 2022 | 2023 | |
| June 2021 | 2.9 to 3.1 | 1.9 to 2.3 | 2.0 to 2.2 | |
| Mar 2021 | 2.0 to 2.3 | 1.9 to 2.1 | 2.0 to 2.2 | |
Saturday, September 18, 2021
Newsletter Articles this Week
by Calculated Risk on 9/18/2021 02:00:00 PM
At the Calculated Risk Newsletter this week:
Analysis:
• The Rapid Increase in Rents; What is happening? Why? And what will happen.
• House Price to Median Income; New Data for 2020 Income
• Household Formation Drives Housing Demand; Some preliminary data and analysis
Local Real Estate data:
• California August Housing: Sales down 11% YoY, "Home sales temper in August"
• 5 More Local Housing Markets in August; Alabama, Austin, Maryland, Phoenix, Rhode Island
• Another 5 Local Housing Markets in August; Boston, Des Moines, Jacksonville, Minnesota, South Carolina
• 5 Additional Local Housing Markets in August; Albuquerque, Colorado, Houston, Memphis and Nashville
This will usually be published several times a week, and will provide more in-depth analysis of the housing market.
The blog will continue as always!
You can subscribe at https://calculatedrisk.substack.com/ (Currently all content is available for free, but please subscribe).
You can subscribe at https://calculatedrisk.substack.com/ (Currently all content is available for free, but please subscribe).
Schedule for Week of September 19, 2021
by Calculated Risk on 9/18/2021 08:11:00 AM
The key reports this week are August Housing Starts, and New and Existing Home sales.
The FOMC meets this week, and no change to policy is expected.
10:00 AM: The September NAHB homebuilder survey. The consensus is for a reading of 74, down from 75 in August. Any number above 50 indicates that more builders view sales conditions as good than poor.
 8:30 AM: Housing Starts for August.
 This graph shows single and total housing starts since 1968.
The consensus is for 1.560 million SAAR, up from 1.534 million SAAR.
7:00 AM ET: The Mortgage Bankers Association (MBA) will release the results for the mortgage purchase applications index.
During the day: The AIA's Architecture Billings Index for August (a leading indicator for commercial real estate).
 10:00 AM: Existing Home Sales for August from the National Association of Realtors (NAR). The consensus is for 5.81 million SAAR, down from 5.99 million in July.
The graph shows existing home sales from 1994 through the report last month.
Housing economist Tom Lawler expects the NAR to report 5.88 million SAAR.
2:00 PM: FOMC Meeting Announcement. No change to policy is expected at this meeting.
2:00 PM: FOMC Forecasts This will include the Federal Open Market Committee (FOMC) participants' projections of the appropriate target federal funds rate along with the quarterly economic projections.
2:30 PM: Fed Chair Jerome Powell holds a press briefing following the FOMC announcement.
8:30 AM: The initial weekly unemployment claims report will be released. The consensus is for 320 thousand initial claims, down from 332 thousand last week.
8:30 AM ET: Chicago Fed National Activity Index for August. This is a composite index of other data.
11:00 AM: the Kansas City Fed manufacturing survey for September.
12:00 PM: Q2 Flow of Funds Accounts of the United States from the Federal Reserve.
 10:00 AM: New Home Sales for August from the Census Bureau.
 This graph shows New Home Sales since 1963. The dashed line is the sales rate for last month.
The consensus is for 714 thousand SAAR, up from 708 thousand in July.
10:00 AM: Opening Remarks, Fed Chair Jerome Powell, At Fed Listens: Perspectives on the Pandemic Recovery
Friday, September 17, 2021
Urban Institute: Median 95% LTV for New Mortgage Originations (Only 5% Downpayment)
by Calculated Risk on 9/17/2021 04:54:00 PM
NYU Stern professor Arpit Gupta tweeted today:
A common intuition is that borrowers put 20% down on a home.He included a chart from the Urban Institute showing the median LTV for new mortgage loan originations is 95% - and has been at that level for the last 12 years.
The median down payment is actually closer to 5%, and has been for 12 years.
Gupta linked to the Housing Finance Policy Center's Monthly Chartbook
Here is the chart that also includes FICO and Debt-to-income (DTI). The median DTI is at 37.5%.
Note that this is combined LTV, and probably includes 2nd loans. Legend at top.


September 17th COVID-19: Over 180 Million Fully Vaccinated
by Calculated Risk on 9/17/2021 04:09:00 PM
Note: There will be no weekend updates.
The CDC is the source for all data.
The 7-day average deaths is the highest since March 1st.
According to the CDC, on Vaccinations. Total doses administered: 383,994,877, as of a week ago 378,569,717. Average doses last week: 0.78 million per day.
| COVID Metrics | ||||
|---|---|---|---|---|
| Today | Week Ago | Goal | ||
| Percent fully Vaccinated | 54.4% | 53.6% | ≥70.0%1 | |
| Fully Vaccinated (millions) | 180.6 | 177.9 | ≥2321 | |
| New Cases per Day3🚩 | 142,736 | 139,221 | ≤5,0002 | |
| Hospitalized3 | 88,506 | 93,097 | ≤3,0002 | |
| Deaths per Day3🚩 | 1,464 | 1,253 | ≤502 | |
| 1 Minimum to achieve "herd immunity" (estimated between 70% and 85%). 2my goals to stop daily posts, 37 day average for Cases, Currently Hospitalized, and Deaths 🚩 Increasing 7 day average week-over-week for Cases, Hospitalized, and Deaths ✅ Goal met. | ||||
IMPORTANT: For "herd immunity" most experts believe we need 70% to 85% of the total population fully vaccinated (or already had COVID).
This is all from the CDC - state data may differ!
KUDOS to the residents of the 11 states that have achieved 60% of total population fully vaccinated: Vermont at 68.8%, Massachusetts, Maine, Connecticut, Rhode Island, Maryland, New Jersey, Washington, New York, New Mexico, New Hampshire at 60.9%.
The following 18 states and D.C. have between 50% and 59.9% fully vaccinated: Oregon at 59.6%, District of Columbia, Virginia, Colorado, Minnesota, California, Hawaii, Delaware, Pennsylvania, Wisconsin, Florida, Nebraska, Iowa, Illinois, Michigan, South Dakota, Kentucky, Arizona and Kansas at 50.0%.
Next up (total population, fully vaccinated according to CDC) are Texas at 49.8%, Nevada at 49.6%, Ohio at 49.4%, Utah at 49.2%, Alaska at 48.8% and North Carolina at 48.4%.
 Click on graph for larger image.
This graph shows the daily (columns) and 7 day average (line) of positive tests reported.
Lawler: Early Read on Existing Home Sales in August
by Calculated Risk on 9/17/2021 01:43:00 PM
From housing economist Tom Lawler (see important comments on inventory):
Based on publicly-available local realtor/MLS reports released across the country through today, I project that existing home sales as estimated by the National Association of Realtors ran at a seasonally adjusted annual rate of 5.90 million in August, down 1.5% from July’s preliminary pace and down 1.2% from last August’s seasonally adjusted pace. Unadjusted sales should show a very small YOY gain, with the SA/NSA difference reflecting this August’s higher business day count relative to last August’s.
Local realtor reports, as well as reports from national inventory trackers, suggest that while the inventory of existing homes for sale remained low last month, the YOY decline in August was significantly less than in July. What this means for the NAR’s inventory estimate for August, however, is unclear. As I’ve noted before, the inventory measure in most publicly-released local realtor/MLS reports excludes listings with pending contracts, but that is not the case for most of the reports sent to the NAR (referred to as the “NAR Report!”), Since the middle of last Spring inventory measures excluding pending listings have fallen much more sharply than inventory measures including such listings, and this latter inventory measure understates the decline in the effective inventory of homes for sale over the last several months. Having said that, however, it is clear that seasonally adjusted inventories have been trending higher over the past several months.
Finally, local realtor/MLS reports suggest the median existing single-family home sales price last month was up by about 14.7% from last August.
CR Note: The National Association of Realtors (NAR) is scheduled to release August existing home sales on Wednesday, September 22, 2021 at 10:00 AM ET. The consensus is for 5.88 million SAAR.


