 RSS Feed
 by Calculated Risk on 7/21/2021 03:38:00 PM
Wednesday, July 21, 2021
July 21st COVID-19, New Cases, Hospitalizations, Vaccinations
The 7-day average cases is the highest since May 9th.
The 7-day average hospitalizations is the highest since May 30th
This data is from the CDC.
According to the CDC, on Vaccinations.
Total doses administered: 339,102,867, as of a week ago 335,487,779. Average doses last week: 0.52 million per day.
KUDOS to the residents of the 20 states and D.C. that have achieved the 70% goal (percent over 18 with at least one dose): Vermont, Hawaii, Massachusetts and Connecticut are at 80%+, and Maine, New Mexico, New Jersey, Rhode Island, Pennsylvania, California, Maryland, Washington, New Hampshire, New York, Illinois, Virginia, Delaware, Minnesota, Oregon, Colorado and D.C. are all over 70%.
According to the CDC, on Vaccinations.
Total doses administered: 339,102,867, as of a week ago 335,487,779. Average doses last week: 0.52 million per day.
| COVID Metrics | ||||
|---|---|---|---|---|
| Today | Yesterday | Week Ago | Goal | |
| Percent over 18, One Dose | 68.4% | 68.3% | 67.8% | ≥70.0%1,2 |
| Fully Vaccinated✅ (millions) | 161.9 | 161.6 | 160.1 | ≥1601 |
| New Cases per Day3🚩 | 37,673 | 35,512 | 24,709 | ≤5,0002 |
| Hospitalized3🚩 | 20,241 | 19,330 | 15,137 | ≤3,0002 |
| Deaths per Day3🚩 | 237 | 245 | 198 | ≤502 |
| 1 America's Short Term Goals, 2my goals to stop daily posts, 37 day average for Cases, Hospitalized, and Deaths 🚩 Increasing 7 day average week-over-week for Cases, Hospitalized, and Deaths ✅ Goal met (even if late). | ||||
KUDOS to the residents of the 20 states and D.C. that have achieved the 70% goal (percent over 18 with at least one dose): Vermont, Hawaii, Massachusetts and Connecticut are at 80%+, and Maine, New Mexico, New Jersey, Rhode Island, Pennsylvania, California, Maryland, Washington, New Hampshire, New York, Illinois, Virginia, Delaware, Minnesota, Oregon, Colorado and D.C. are all over 70%.
Next up are Florida at 66.8%, Utah at 66.7%, Wisconsin at 66.5%, Nebraska at 66.4%, South Dakota at 65.2%, and Iowa at 64.9%.
 Click on graph for larger image.
This graph shows the daily (columns) and 7 day average (line) of positive tests reported.
This data is from the CDC.
Alabama Real Estate in June: Sales Up 15% YoY, Inventory Down 40% YoY
by Calculated Risk on 7/21/2021 01:33:00 PM
Note: I'm tracking data for many local markets around the U.S. I think it is especially important to watch inventory this year.
For the entire state of Alabama:
Closed sales in June 2021 were 8,234, up 14.6% from 7,184 in June 2020.
Active Listings in June 2021 were 9,954, down 39.7% from 16,518 in June 2020.
Months of Supply was 1.2 Months in June 2021, compared to 2.3 Months in June 2020.
Inventory in June was up 6.3% from last month.
CoreLogic: Single-Family Rents Up 6.6% Year Over Year in May
by Calculated Risk on 7/21/2021 12:22:00 PM
Housing economist Tom Lawler has been tracking this, see: Lawler: Single-Family Rent Trends. This will likely push up Owner's Equivalent Rent (OER, a key component of CPI) in the coming months.
From CoreLogic: U.S. Single-Family Rents Up 6.6% Year Over Year in May
U.S. single-family rent growth increased 6.6% in May 2021, the fastest year-over-year increase since at least January 2005[1], according to the CoreLogic Single-Family Rent Index (SFRI). The May 2021 increase was nearly four times the May 2020 increase. The index measures rent changes among single-family rental homes, including condominiums, using a repeat-rent analysis to measure the same rental properties over time.
An uneven U.S. job recovery, sometimes called a “K-shaped” recovery, is reflected in the rent price growth of the low- and high-price rent tiers, with the increase in lower-priced rentals lagging behind that of higher-priced rentals. The low-price tier is defined as properties with rent prices less than 75% of the regional median, and the high-price tier is defined as properties with rent prices greater than 125% of a region’s median rent (Figure 1).
Click on graph for larger image.
Rent prices for the low-price tier, increased 4.6% year over year in May 2021, up from 2.7% in May 2020. Meanwhile, high-price rentals increased 7.9% in May 2021, up from a gain of 1.3% in May 2020. This was the fastest increase in low-price rents since January 2017, and the fastest increase in high-price rentals in the history of the SFRI.
Differences in rent growth by property type emerged after the pandemic as renters sought out standalone properties in lower density areas (Figure 2). The detached property type tier is defined as properties with a free-standing residential building, and the attached property type tier is defined as a single-family dwelling that is attached to other single-family dwellings, which includes duplexes, triplexes, quadplexes, townhouses, row-houses, condos and co-ops.
As demand for more space and outdoor amenities remains, detached rentals in particular are experiencing accelerated growth with a 9.2% year-over-year increase in May, compared to growth of 3.6% annually for attached rentals.


AIA: "Architecture Billings Index robust growth continues" in June
by Calculated Risk on 7/21/2021 10:00:00 AM
Note: This index is a leading indicator primarily for new Commercial Real Estate (CRE) investment.
From the AIA: Architecture Billings Index robust growth continues
Architecture firms reported increasing demand for design services in June according to a new report today from The American Institute of Architects (AIA).
AIA’s Architecture Billings Index (ABI) score for June remained at an elevated level of 57.1 in June (any score above 50 indicates an increase in billings). During June, the new design contracts score also remained positive at 58.9 but was not quite as strong as the 63.2 reading in May. New project inquiries logged another near-record high score at 71.8, compared to 69.2 in May.
“With the current pace of billings growth near the highest levels ever seen in the history of the index, we’re expecting a sharp upturn in nonresidential building activity later this year and into 2022,” said AIA Chief Economist Kermit Baker, Hon. AIA, PhD. “However, as is often the case when market conditions make a sudden reversal, concerns are growing about architecture firms not being able to find enough workers to meet the higher workloads. Nearly six in 10 firms report that they are having problems filling open architectural staff positions.”
...
• Regional averages: Midwest (62.0); West (59.7); South (57.3); Northeast (53.2)
• Sector index breakdown: commercial/industrial (61.0); multi-family residential (57.9); institutional (57.3); mixed practice (56.4)
emphasis added
 Click on graph for larger image.
This graph shows the Architecture Billings Index since 1996. The index was at 57.1 in June, down from 58.5 in May. Anything above 50 indicates expansion in demand for architects' services.
Note: This includes commercial and industrial facilities like hotels and office buildings, multi-family residential, as well as schools, hospitals and other institutions.
This index had been below 50 for eleven consecutive months, but has been solidly positive for the last five months.
The eleven months of decline represented a significant decrease in design services, and suggests a decline in CRE investment through most of 2021 (This usually leads CRE investment by 9 to 12 months), however we might see a pickup in CRE investment towards the end of the 2021 and into 2022.
MBA: Mortgage Applications Decrease in Latest Weekly Survey
by Calculated Risk on 7/21/2021 07:00:00 AM
From the MBA: Mortgage Applications Decrease in Latest MBA Weekly Survey
Mortgage applications decreased 4.0 percent from one week earlier, according to data from the Mortgage Bankers Association’s (MBA) Weekly Mortgage Applications Survey for the week ending July 16, 2021. The previous week’s results included an adjustment for the Fourth of July holiday.
... The Refinance Index decreased 3 percent from the previous week and was 18 percent lower than the same week one year ago. The seasonally adjusted Purchase Index decreased 6 percent from one week earlier. The unadjusted Purchase Index increased 17 percent compared with the previous week and was 18 percent lower than the same week one year ago.
“The 10-year Treasury yield dropped sharply last week, in part due to investors becoming more concerned about the spread of COVID variants and their impact on global economic growth. There were mixed changes in mortgage rates as a result, with the 30-year fixed rate increasing slightly to 3.11 percent after two weeks of declines. Other surveyed rates moved lower, with the 15-year fixed rate loan, used by around 20 percent of refinance borrowers, decreasing to 2.46 percent – the lowest level since January 2021,” said Joel Kan, MBA’s Associate Vice President of Economic and Industry Forecasting.
“On a seasonally adjusted basis compared to the July 4th holiday week, mortgage applications were lower across the board, with purchase applications back to near their lowest levels since May 2020. Limited inventory and higher prices are keeping some prospective homebuyers out of the market. Refinance activity fell over the week, but because rates have stayed relatively low, the pace of applications was close to its highest level since early May 2021.”
...
The average contract interest rate for 30-year fixed-rate mortgages with conforming loan balances ($548,250 or less) increased to 3.11 percent from 3.09 percent, with points increasing to 0.43 from 0.37 (including the origination fee) for 80 percent loan-to-value ratio (LTV) loans.
emphasis added
 Click on graph for larger image.
The first graph shows the refinance index since 1990.
With low rates, the index remains elevated, and will likely increase this coming week as rates declined.
The second graph shows the MBA mortgage purchase index
 According to the MBA, purchase activity is down 18% year-over-year unadjusted.
Note: The year ago comparisons for the unadjusted purchase index are now difficult since purchase activity picked up in late May 2020.
Note: Red is a four-week average (blue is weekly).
Tuesday, July 20, 2021
July 20th COVID-19, New Cases, Hospitalizations, Vaccinations
by Calculated Risk on 7/20/2021 08:04:00 PM
The 7-day average cases is the highest since May 11th.
The 7-day average hospitalizations is the highest since June 1st.
This data is from the CDC.
According to the CDC, on Vaccinations.
Total doses administered: 338,491,374, as of a week ago 334,942,236. Average doses last week: 0.51 million per day.
KUDOS to the residents of the 20 states and D.C. that have achieved the 70% goal (percent over 18 with at least one dose): Vermont, Hawaii, Massachusetts and Connecticut are at 80%+, and Maine, New Mexico, New Jersey, Rhode Island, Pennsylvania, California, Maryland, Washington, New Hampshire, New York, Illinois, Virginia, Delaware, Minnesota, Oregon, Colorado and D.C. are all over 70%.
According to the CDC, on Vaccinations.
Total doses administered: 338,491,374, as of a week ago 334,942,236. Average doses last week: 0.51 million per day.
| COVID Metrics | ||||
|---|---|---|---|---|
| Today | Yesterday | Week Ago | Goal | |
| Percent over 18, One Dose | 68.3% | 68.3% | 67.7% | ≥70.0%1,2 |
| Fully Vaccinated✅ (millions) | 161.6 | 161.5 | 159.7 | ≥1601 |
| New Cases per Day3🚩 | 35,547 | 33,541 | 22,222 | ≤5,0002 |
| Hospitalized3🚩 | 19,251 | 18,460 | 14,308 | ≤3,0002 |
| Deaths per Day3🚩 | 245 | 240 | 171 | ≤502 |
| 1 America's Short Term Goals, 2my goals to stop daily posts, 37 day average for Cases, Hospitalized, and Deaths 🚩 Increasing 7 day average week-over-week for Cases, Hospitalized, and Deaths ✅ Goal met (even if late). | ||||
KUDOS to the residents of the 20 states and D.C. that have achieved the 70% goal (percent over 18 with at least one dose): Vermont, Hawaii, Massachusetts and Connecticut are at 80%+, and Maine, New Mexico, New Jersey, Rhode Island, Pennsylvania, California, Maryland, Washington, New Hampshire, New York, Illinois, Virginia, Delaware, Minnesota, Oregon, Colorado and D.C. are all over 70%.
Next up are Florida at 66.7%, Utah at 66.7%, Wisconsin at 66.4%, Nebraska at 66.3%, South Dakota at 65.2%, and Iowa at 64.8%.
 Click on graph for larger image.
This graph shows the daily (columns) and 7 day average (line) of positive tests reported.
This data is from the CDC.
Indiana Real Estate in June: Sales Up 9% YoY, Inventory Down 36% YoY
by Calculated Risk on 7/20/2021 03:03:00 PM
Note: I'm tracking data for many local markets around the U.S. I think it is especially important to watch inventory this year.
For for the entire state Indiana:
Closed sales in June 2021 were 9,969, up 9.2% from 9,127 in June 2020.
Active Listings in June 2021 were 7,743, down 36.2% from 12,139 in June 2020.
Months of Supply was 0.9 Months in June 2021, compared to 1.6 Months in June 2020.
Inventory in June was up 18.1% from last month, and up 31.3% from 5,898 in March 2021.
Existing Home Sales: Lawler vs. the Consensus
by Calculated Risk on 7/20/2021 12:15:00 PM
Housing economist Tom Lawler has been sending me his predictions of what the NAR will report for over 11 years. And he has graciously allowed me to share his predictions with the readers of this blog.
The table below shows the consensus for each month, Lawler's predictions, and the NAR's initially reported level of sales.
Lawler hasn't always been closer than the consensus, but usually when there has been a fairly large spread between Lawler's estimate and the "consensus", Lawler has been closer.
For example, last month Lawler estimated the NAR would report sales of 5.78 million SAAR, the consensus was 5.74 million SAAR, and the NAR reported 5.80 million SAAR.
The NAR is scheduled to release Existing Home Sales for June at 10:00 AM, Thursday, July 22nd.
The consensus is for 5.90 million SAAR in June, up from 5.80 million in May. Tom Lawler estimates the NAR will report sales of 5.79 million SAAR. Based on Lawler's estimate, I expect existing home sales to be slightly below the consensus in June.
NOTE: There have been times when Lawler "missed", but then he pointed out an apparent error in the NAR data - and the subsequent revision corrected that error. As an example, see: The “Curious Case” of Existing Home Sales in the South in April
Over the last 11+ years, the consensus average miss was 147 thousand, and Lawler's average miss was 73 thousand.
| Existing Home Sales, Forecasts and NAR Report millions, seasonally adjusted annual rate basis (SAAR) | |||
|---|---|---|---|
| Month | Consensus | Lawler | NAR reported1 |
| May-10 | 6.20 | 5.83 | 5.66 |
| Jun-10 | 5.30 | 5.30 | 5.37 |
| Jul-10 | 4.66 | 3.95 | 3.83 |
| Aug-10 | 4.10 | 4.10 | 4.13 |
| Sep-10 | 4.30 | 4.50 | 4.53 |
| Oct-10 | 4.50 | 4.46 | 4.43 |
| Nov-10 | 4.85 | 4.61 | 4.68 |
| Dec-10 | 4.90 | 5.13 | 5.28 |
| Jan-11 | 5.20 | 5.17 | 5.36 |
| Feb-11 | 5.15 | 5.00 | 4.88 |
| Mar-11 | 5.00 | 5.08 | 5.10 |
| Apr-11 | 5.20 | 5.15 | 5.05 |
| May-11 | 4.75 | 4.80 | 4.81 |
| Jun-11 | 4.90 | 4.71 | 4.77 |
| Jul-11 | 4.92 | 4.69 | 4.67 |
| Aug-11 | 4.75 | 4.92 | 5.03 |
| Sep-11 | 4.93 | 4.83 | 4.91 |
| Oct-11 | 4.80 | 4.86 | 4.97 |
| Nov-11 | 5.08 | 4.40 | 4.42 |
| Dec-11 | 4.60 | 4.64 | 4.61 |
| Jan-12 | 4.69 | 4.66 | 4.57 |
| Feb-12 | 4.61 | 4.63 | 4.59 |
| Mar-12 | 4.62 | 4.59 | 4.48 |
| Apr-12 | 4.66 | 4.53 | 4.62 |
| May-12 | 4.57 | 4.66 | 4.55 |
| Jun-12 | 4.65 | 4.56 | 4.37 |
| Jul-12 | 4.50 | 4.47 | 4.47 |
| Aug-12 | 4.55 | 4.87 | 4.82 |
| Sep-12 | 4.75 | 4.70 | 4.75 |
| Oct-12 | 4.74 | 4.84 | 4.79 |
| Nov-12 | 4.90 | 5.10 | 5.04 |
| Dec-12 | 5.10 | 4.97 | 4.94 |
| Jan-13 | 4.90 | 4.94 | 4.92 |
| Feb-13 | 5.01 | 4.87 | 4.98 |
| Mar-13 | 5.03 | 4.89 | 4.92 |
| Apr-13 | 4.92 | 5.03 | 4.97 |
| May-13 | 5.00 | 5.20 | 5.18 |
| Jun-13 | 5.27 | 4.99 | 5.08 |
| Jul-13 | 5.13 | 5.33 | 5.39 |
| Aug-13 | 5.25 | 5.35 | 5.48 |
| Sep-13 | 5.30 | 5.26 | 5.29 |
| Oct-13 | 5.13 | 5.08 | 5.12 |
| Nov-13 | 5.02 | 4.98 | 4.90 |
| Dec-13 | 4.90 | 4.96 | 4.87 |
| Jan-14 | 4.70 | 4.67 | 4.62 |
| Feb-14 | 4.64 | 4.60 | 4.60 |
| Mar-14 | 4.56 | 4.64 | 4.59 |
| Apr-14 | 4.67 | 4.70 | 4.65 |
| May-14 | 4.75 | 4.81 | 4.89 |
| Jun-14 | 4.99 | 4.96 | 5.04 |
| Jul-14 | 5.00 | 5.09 | 5.15 |
| Aug-14 | 5.18 | 5.12 | 5.05 |
| Sep-14 | 5.09 | 5.14 | 5.17 |
| Oct-14 | 5.15 | 5.28 | 5.26 |
| Nov-14 | 5.20 | 4.90 | 4.93 |
| Dec-14 | 5.05 | 5.15 | 5.04 |
| Jan-15 | 5.00 | 4.90 | 4.82 |
| Feb-15 | 4.94 | 4.87 | 4.88 |
| Mar-15 | 5.04 | 5.18 | 5.19 |
| Apr-15 | 5.22 | 5.20 | 5.04 |
| May-15 | 5.25 | 5.29 | 5.35 |
| Jun-15 | 5.40 | 5.45 | 5.49 |
| Jul-15 | 5.41 | 5.64 | 5.59 |
| Aug-15 | 5.50 | 5.54 | 5.31 |
| Sep-15 | 5.35 | 5.56 | 5.55 |
| Oct-15 | 5.41 | 5.33 | 5.36 |
| Nov-15 | 5.32 | 4.97 | 4.76 |
| Dec-15 | 5.19 | 5.36 | 5.46 |
| Jan-16 | 5.32 | 5.36 | 5.47 |
| Feb-16 | 5.30 | 5.20 | 5.08 |
| Mar-16 | 5.27 | 5.27 | 5.33 |
| Apr-16 | 5.40 | 5.44 | 5.45 |
| May-16 | 5.64 | 5.55 | 5.53 |
| Jun-16 | 5.48 | 5.62 | 5.57 |
| Jul-16 | 5.52 | 5.41 | 5.39 |
| Aug-16 | 5.44 | 5.49 | 5.33 |
| Sep-16 | 5.35 | 5.55 | 5.47 |
| Oct-16 | 5.44 | 5.47 | 5.60 |
| Nov-16 | 5.54 | 5.60 | 5.61 |
| Dec-16 | 5.54 | 5.55 | 5.49 |
| Jan-17 | 5.55 | 5.60 | 5.69 |
| Feb-17 | 5.55 | 5.41 | 5.48 |
| Mar-17 | 5.61 | 5.74 | 5.71 |
| Apr-17 | 5.67 | 5.56 | 5.57 |
| May-17 | 5.55 | 5.65 | 5.62 |
| Jun-17 | 5.58 | 5.59 | 5.52 |
| Jul-17 | 5.57 | 5.38 | 5.44 |
| Aug-17 | 5.48 | 5.39 | 5.35 |
| Sep-17 | 5.30 | 5.38 | 5.39 |
| Oct-17 | 5.30 | 5.60 | 5.48 |
| Nov-17 | 5.52 | 5.77 | 5.81 |
| Dec-17 | 5.75 | 5.66 | 5.57 |
| Jan-18 | 5.65 | 5.48 | 5.38 |
| Feb-18 | 5.42 | 5.44 | 5.54 |
| Mar-18 | 5.28 | 5.51 | 5.60 |
| Apr-18 | 5.60 | 5.48 | 5.46 |
| May-18 | 5.56 | 5.47 | 5.43 |
| Jun-18 | 5.45 | 5.35 | 5.38 |
| Jul-18 | 5.43 | 5.40 | 5.34 |
| Aug-18 | 5.36 | 5.36 | 5.34 |
| Sep-18 | 5.30 | 5.20 | 5.15 |
| Oct-18 | 5.20 | 5.31 | 5.22 |
| Nov-18 | 5.19 | 5.23 | 5.32 |
| Dec-18 | 5.24 | 4.97 | 4.99 |
| Jan-19 | 5.05 | 4.92 | 4.94 |
| Feb-19 | 5.08 | 5.46 | 5.51 |
| Mar-19 | 5.30 | 5.40 | 5.21 |
| Apr-19 | 5.36 | 5.31 | 5.19 |
| May-19 | 5.29 | 5.40 | 5.34 |
| Jun-19 | 5.34 | 5.25 | 5.27 |
| Jul-19 | 5.39 | 5.40 | 5.42 |
| Aug-19 | 5.38 | 5.42 | 5.49 |
| Sep-19 | 5.45 | 5.36 | 5.38 |
| Oct-19 | 5.49 | 5.36 | 5.46 |
| Nov-19 | 5.45 | 5.43 | 5.35 |
| Dec-19 | 5.43 | 5.40 | 5.54 |
| Jan-20 | 5.45 | 5.42 | 5.46 |
| Feb-20 | 5.50 | 5.58 | 5.77 |
| Mar-20 | 5.30 | 5.25 | 5.27 |
| Apr-20 | 4.30 | 4.17 | 4.33 |
| May-20 | 4.38 | 3.80 | 3.91 |
| Jun-20 | 4.86 | 4.65 | 4.72 |
| Jul-20 | 5.39 | 5.85 | 5.86 |
| Aug-20 | 6.00 | 5.92 | 6.00 |
| Sep-20 | 6.25 | 6.38 | 6.54 |
| Oct-20 | 6.45 | 6.63 | 6.85 |
| Nov-20 | 6.70 | 6.50 | 6.69 |
| Dec-20 | 6.55 | 6.62 | 6.76 |
| Jan-21 | 6.60 | 6.48 | 6.69 |
| Feb-21 | 6.51 | 6.29 | 6.22 |
| Mar-21 | 6.17 | 6.02 | 6.01 |
| Apr-21 | 6.09 | 5.96 | 5.85 |
| May-21 | 5.74 | 5.78 | 5.80 |
| Jun-21 | 5.90 | 5.79 | NA |
| 1NAR initially reported before revisions. | |||
Comments on June Housing Starts
by Calculated Risk on 7/20/2021 10:20:00 AM
Earlier: Housing Starts increased to 1.643 Million Annual Rate in June
Total housing starts in June were above expectations, however starts in April and May were revised down.
Single family starts increased in June, and were up 28% year-over-year. Starts declined at the beginning of the pandemic, and then increased due to strong demand.
The volatile multi-family sector is up 31% year-over-year.
The housing starts report showed total starts were up 6.3% in June compared to the previous month, and total starts were up 29.1% year-over-year compared to June 2020.
The housing starts report showed total starts were up 6.3% in June compared to the previous month, and total starts were up 29.1% year-over-year compared to June 2020.
Low mortgage rates, limited existing home inventory, and favorable demographics have given a boost to single family housing starts.
The first graph shows the month to month comparison for total starts between 2020 (blue) and 2021 (red).
 Click on graph for larger image.
Starts were up 29.1% in June compared to June 2020. The year-over-year comparison will be more difficult starting in July.
In 2020, starts were off to a strong start before the pandemic, and with low interest rates, and little competing existing home inventory, starts finished 2020 strong.
Starts were solid in the first half of 2021.
Below is an update to the graph comparing multi-family starts and completions. Since it usually takes over a year on average to complete a multi-family project, there is a lag between multi-family starts and completions. Completions are important because that is new supply added to the market, and starts are important because that is future new supply (units under construction is also important for employment).
These graphs use a 12 month rolling total for NSA starts and completions.
 The blue line is for multifamily starts and the red line is for multifamily completions.
The rolling 12 month total for starts (blue line) increased steadily for several years following the great recession - then mostly moved sideways.
These graphs use a 12 month rolling total for NSA starts and completions.
 The blue line is for multifamily starts and the red line is for multifamily completions.
 The rolling 12 month total for starts (blue line) increased steadily for several years following the great recession - then mostly moved sideways.
Completions (red line) had lagged behind starts, but have caught up again.
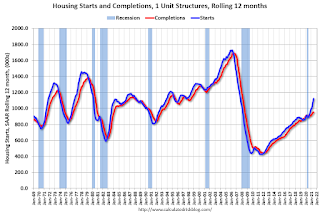 The last graph shows single family starts and completions. It usually only takes about 6 months between starting a single family home and completion - so the lines are much closer. The blue line is for single family starts and the red line is for single family completions.
Single family starts are getting back to more normal levels, but I still expect some further increases in single family starts and completions on a rolling 12 month basis - especially given the low level of existing home inventory.
Housing Starts increased to 1.643 Million Annual Rate in June
by Calculated Risk on 7/20/2021 08:37:00 AM
From the Census Bureau: Permits, Starts and Completions
Housing Starts:
Privately‐owned housing starts in June were at a seasonally adjusted annual rate of 1,643,000. This is 6.3 percent above the revised May estimate of 1,546,000 and is 29.1 percent above the June 2020 rate of 1,273,000. Single‐family housing starts in June were at a rate of 1,160,000; this is 6.3 percent above the revised May figure of 1,091,000. The June rate for units in buildings with five units or more was 474,000.
Building Permits:
Privately‐owned housing units authorized by building permits in June were at a seasonally adjusted annual rate of 1,598,000. This is 5.1 percent below the revised May rate of 1,683,000, but is 23.3 percent above the June 2020 rate of 1,296,000. Single‐family authorizations in June were at a rate of 1,063,000; this is 6.3 percent below the revised May figure of 1,134,000. Authorizations of units in buildings with five units or more were at a rate of 483,000 in June.
emphasis added
 Click on graph for larger image.
The first graph shows single and multi-family housing starts for the last several years.
Multi-family starts (red, 2+ units) increased in June compared to May. Multi-family starts were up 31% year-over-year in June.
Single-family starts (blue) increased in June, and were up 28% year-over-year (starts slumped at the beginning of the pandemic).
 The second graph shows total and single unit starts since 1968.
 The second graph shows the huge collapse following the housing bubble, and then the eventual recovery (but still not historically high).
Total housing starts in June were above expectations, however starts in April and May were revised down.
I'll have more later …


