 RSS Feed
 by Calculated Risk on 6/05/2021 05:17:00 PM
Saturday, June 05, 2021
June 5th COVID-19 New Cases, Vaccinations, Hospitalizations
This data is from the CDC.
According to the CDC, on Vaccinations.
Total doses administered: 300,268,730, as of yesterday 299,120,522. Per Day: 1.15 million.
| COVID Metrics | |||
|---|---|---|---|
| Current | Yesterday | Goal | |
| Percent over 18, One Dose | 63.4% | 63.2% | ≥70.0%1,2 |
| Fully Vaccinated (millions) | 138.1 | 137.5 | ≥1601 |
| New Cases per Day3 | 13,381 | 13,972 | ≤5,0002 |
| Hospitalized3 | 18,247 | 18,770 | ≤3,0002 |
| Deaths per Day3 | 346 | 331 | ≤502 |
| 1 America's Goal by July 4th, 2my goals to stop daily posts, 37 day average for Cases, Hospitalized, and Deaths | |||
KUDOS to the residents of the 12 states that have already achieved the 70% goal: Vermont and Hawaii are over 80%, plus Massachusetts, Connecticut, Maine, New Jersey, Rhode Island, New Mexico, Pennsylvania, New Hampshire, Maryland, and California are all over 70%.
Next up are Washington at 69.9%, D.C. at 68.8%, New York at 68.6%, Illinois at 68.2%, Minnesota at 67.9%, Virginia at 67.9%, Delaware at 67.0%, Colorado at 66.7% and Oregon at 66.6%.
Schedule for Week of June 6, 2021
by Calculated Risk on 6/05/2021 08:11:00 AM
The key report this week is CPI.
Other key reports include April job openings, and the April trade balance.
No major economic releases scheduled.
6:00 AM ET: NFIB Small Business Optimism Index for May.
 8:30 AM: Trade Balance report for April from the Census Bureau.
 In March, exports were up 8.1% compared to March 2020; imports were up 18.1% compared to March 2020.
Both imports and exports decreased sharply due to COVID-19, and have now bounced back (imports much more than exports).
The consensus is the trade deficit to be $69.0 billion. The U.S. trade deficit was at $74.4 Billion in March.
 10:00 AM ET: Job Openings and Labor Turnover Survey for April from the BLS.
 This graph shows job openings (yellow line), hires (purple), Layoff, Discharges and other (red column), and Quits (light blue column) from the JOLTS.
Jobs openings increased in March to 8.123 million from 7.526 million in February.
The number of job openings (yellow) were down 41% year-over-year, and Quits were up 21% year-over-year.
7:00 AM ET: The Mortgage Bankers Association (MBA) will release the results for the mortgage purchase applications index.
8:30 AM: The initial weekly unemployment claims report will be released. The consensus is for a decrease to 380 thousand from 385 thousand last week.
8:30 AM: The Consumer Price Index for May from the BLS. The consensus is for 0.4% increase in CPI, and a 0.4% increase in core CPI.
12:00 PM: Q1 Flow of Funds Accounts of the United States from the Federal Reserve.
10:00 AM: University of Michigan's Consumer sentiment index (Preliminary for June).
Friday, June 04, 2021
Q2 GDP Forecasts: Around 10%
by Calculated Risk on 6/04/2021 05:36:00 PM
From Merrill Lynch:
We continue to track 11% qoq saar for 2Q GDP. [June 4 estimate]From Goldman Sachs:
emphasis added
Following this morning's data, we left our Q2 GDP tracking estimate unchanged at +9.5% (qoq ar). [June 4 estimate]From the NY Fed Nowcasting Report
The New York Fed Staff Nowcast stands at 4.4% for 2021:Q2 and 5.4% for 2021:Q3. [June 4 estimate]And from the Altanta Fed: GDPNow
The GDPNow model estimate for real GDP growth (seasonally adjusted annual rate) in the second quarter of 2021 is 10.3 percent on June 1, up from 9.3 percent on May 28. [June 1 estimate]
June 4th COVID-19 New Cases, Vaccinations, Hospitalizations
by Calculated Risk on 6/04/2021 05:30:00 PM
This data is from the CDC.
According to the CDC, on Vaccinations.
Total doses administered: 299,120,522, as of yesterday 297,720,928. Per Day: 1.40 million.
| COVID Metrics | |||
|---|---|---|---|
| Current | Yesterday | Goal | |
| Percent over 18, One Dose | 63.2% | 63.0% | ≥70.0%1,2 |
| Fully Vaccinated (millions) | 137.5 | 136.6 | ≥1601 |
| New Cases per Day3 | 13,907 | 14,546 | ≤5,0002 |
| Hospitalized3 | 18,770 | 19,289 | ≤3,0002 |
| Deaths per Day3 | 331 | 324 | ≤502 |
| 1 America's Goal by July 4th, 2my goals to stop daily posts, 37 day average for Cases, Hospitalized, and Deaths | |||
KUDOS to the residents of the twelve states that have already achieved the 70% goal: Vermont and Hawaii are over 80%, plus Massachusetts, Connecticut, Maine, New Jersey, Rhode Island, New Mexico, Pennsylvania, New Hampshire, Maryland and California are all over 70%.
Next up are Washington at 69.9%, D.C. at 68.6%, New York at 68.4%, Illinois at 67.9%, Minnesota at 67.7%, Virginia at 67.7%, Delaware at 67.0%, Colorado at 66.7% and Oregon at 66.4%.
AAR: May Rail Carloads down, Intermodal Up Compared to 2019
by Calculated Risk on 6/04/2021 12:59:00 PM
From the Association of American Railroads (AAR) Rail Time Indicators. Graphs and excerpts reprinted with permission.
U.S. rail volumes in May 2021 were encouraging. Total originated carloads averaged 241,089 per week, the most since October 2019 and up 30.4% over May 2020.
...
Meanwhile, intermodal averaged 287,956 originated containers and trailers per week in May 2021. That’s down a bit from April — when the weekly average of 293,488 set a new all-time record — but it’s still the seventh most for any month in history and by far the most ever for May.
emphasis added
 Click on graph for larger image.
This graph from the Rail Time Indicators report shows the six week average of U.S. Carloads in 2019, 2020 and 2021:
In May 2021, total U.S. rail carloads averaged 241,089 per week — up 30.4% over May 2020 and the most for any month since October 2019.
...
Carloads excluding coal were up 26.6% in May 2021 over May 2020 and down 1.2% from May 2019.
 The second graph shows the six week average of U.S. intermodal in 2019, 2020 and 2021: (using intermodal or shipping containers):
For intermodal, volumes in May 2021 were up 26.2% over May 2020, averaging 287,956 containers and trailers per week. That’s down a bit from April 2021 — when the weekly average of 293,488 set a new all-time monthly record — but it’s still the seventh most for any month in history and by far the most ever for May.
Hotels: Occupancy Rate Down 4% Compared to Same Week in 2019
by Calculated Risk on 6/04/2021 11:46:00 AM
Note: The year-over-year occupancy comparisons are easy, since occupancy declined sharply at the onset of the pandemic. So STR is comparing to the same week in 2019.
The occupancy rate is down 4.2% compared to the same week in 2019 (skewed by timing of Memorial Day), but the 4-week average is still down significantly compared to normal.
Boosted by the Friday and Saturday of Memorial Day weekend, U.S. weekly hotel occupancy reached its highest level since late-February 2020, according to STR‘s latest data through 29 May.The following graph shows the seasonal pattern for the hotel occupancy rate using the four week average.
23-29 May 2021 (percentage change from comparable week in 2019*):
• Occupancy: 61.8% (-4.2%)
• Average daily rate (ADR): US$122.06 (-1.6%)
• Revenue per available room (RevPAR): US$75.42 (-5.7%)
Percentage changes were skewed more to the positive because the 2019 comparable was the week after Memorial Day. Regardless, this past Saturday’s 83.0% occupancy level was the country’s highest since October 2019. Weekly ADR and RevPAR were boosted to pandemic-era highs as well. STR analysts note that while the positives around leisure demand are obvious headed into the summer, the path to recovery remains a rollercoaster with a lack of business travel, both domestic and international, preventing hotels in many markets from making up more of the ground lost in 2020.
emphasis added
 Click on graph for larger image.
The red line is for 2021, black is 2020, blue is the median, dashed purple is 2019, and dashed light blue is for 2009 (the worst year on record for hotels prior to 2020).
Occupancy is now above the horrible 2009 levels and weekend occupancy (leisure) has leisure has been solid.
Note: Y-axis doesn't start at zero to better show the seasonal change.
Note: Y-axis doesn't start at zero to better show the seasonal change.
Comments on May Employment Report
by Calculated Risk on 6/04/2021 09:22:00 AM
The headline jobs number in the April employment report was below expectations, however employment for the previous two months was revised up slightly.
Leisure and hospitality gained 292 thousand jobs. In March and April of 2020, leisure and hospitality lost 8.2 million jobs, and are now down 2.54 million jobs since February 2020. So leisure and hospitality has now added back almost 70% of the jobs lost in March and April 2020.
Construction employment declined 20 thousand in May, and State and Local education added 103 thousand jobs. Manufacturing added 23 thousand jobs.
Earlier: May Employment Report: 559 Thousand Jobs, 5.8% Unemployment Rate
In April, the year-over-year employment change was 11.900 million jobs. This turned positive in April due to the sharp jobs losses in April 2020.
Permanent Job Losers
 Click on graph for larger image.
This graph shows permanent job losers as a percent of the pre-recession peak in employment through the May report. (ht Joe Weisenthal at Bloomberg).
These jobs will likely be the hardest to recover.
This data is only available back to 1994, so there is only data for three recessions.
In May, the number of permanent job losers decreased to 3.234 million from 3.529 million in April.
Prime (25 to 54 Years Old) Participation
 Since the overall participation rate has declined due to cyclical (recession) and demographic (aging population, younger people staying in school) reasons, here is the employment-population ratio for the key working age group: 25 to 54 years old.
The prime working age will be key in the recovery.
The 25 to 54 participation rate was unchanged in May at 81.3% from 81.3% in April, and the 25 to 54 employment population ratio increased to 77.1% from 76.9% in April.
Part Time for Economic Reasons
 From the BLS report:
These workers are included in the alternate measure of labor underutilization (U-6) that decreased to 10.2% from 10.4% in April. This is down from the record high in April 22.9% for this measure since 1994.
Unemployed over 26 Weeks
 This graph shows the number of workers unemployed for 27 weeks or more.
According to the BLS, there are 3.752 million workers who have been unemployed for more than 26 weeks and still want a job, down from 4.183 million in April.
This does not include all the people that left the labor force. This will be a key measure to follow during the recovery.
Summary:
The headline monthly jobs number was below expectations, however the previous two months were revised up by 27,000 combined. The headline unemployment rate decreased to 5.8%, but the participation rate declined slightly.
This data is only available back to 1994, so there is only data for three recessions.
In May, the number of permanent job losers decreased to 3.234 million from 3.529 million in April.
Prime (25 to 54 Years Old) Participation
 Since the overall participation rate has declined due to cyclical (recession) and demographic (aging population, younger people staying in school) reasons, here is the employment-population ratio for the key working age group: 25 to 54 years old.
The prime working age will be key in the recovery.
The 25 to 54 participation rate was unchanged in May at 81.3% from 81.3% in April, and the 25 to 54 employment population ratio increased to 77.1% from 76.9% in April.
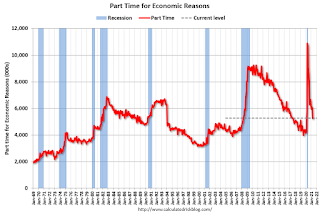
Part Time for Economic Reasons
 From the BLS report:
"The number of persons employed part time for economic reasons was essentially unchanged at 5.3 million in May but is 873,000 higher than in February 2020. These individuals, who would have preferred full-time employment, were working part time because their hours had been reduced or they were unable to find full-time jobs."The number of persons working part time for economic reasons increased slightly in May to 5.271 million from 5.243 million in April.
These workers are included in the alternate measure of labor underutilization (U-6) that decreased to 10.2% from 10.4% in April. This is down from the record high in April 22.9% for this measure since 1994.
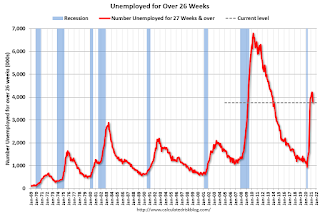
Unemployed over 26 Weeks
 This graph shows the number of workers unemployed for 27 weeks or more.
 According to the BLS, there are 3.752 million workers who have been unemployed for more than 26 weeks and still want a job, down from 4.183 million in April.
This does not include all the people that left the labor force. This will be a key measure to follow during the recovery.
Summary:
The headline monthly jobs number was below expectations, however the previous two months were revised up by 27,000 combined. The headline unemployment rate decreased to 5.8%, but the participation rate declined slightly.
There are still 7.6 million fewer jobs than in February 2020, and 3.2 million people have lost jobs permanently.
May Employment Report: 559 Thousand Jobs, 5.8% Unemployment Rate
by Calculated Risk on 6/04/2021 08:41:00 AM
From the BLS:
Total nonfarm payroll employment rose by 559,000 in May, and the unemployment rate declined by 0.3 percentage point to 5.8 percent, the U.S. Bureau of Labor Statistics reported today. Notable job gains occurred in leisure and hospitality, in public and private education, and in health care and social assistance.
...
The change in total nonfarm payroll employment for March was revised up by 15,000, from +770,000 to +785,000, and the change for April was revised up by 12,000, from +266,000 to +278,000. With these revisions, employment in March and April combined is 27,000 higher than previously reported.
emphasis added
 Click on graph for larger image.
The first graph shows the year-over-year change in total non-farm employment since 1968.
In May, the year-over-year change was 11.900 million jobs. This was up significantly - since employment collapsed in April 2020.
Total payrolls increased by 559 thousand in May. Private payrolls increased by 492 thousand.
Payrolls for March and April were revised up 27 thousand, combined.
 The second graph shows the job losses from the start of the employment recession, in percentage terms.
The current employment recession was by far the worst recession since WWII in percentage terms, but currently is not as severe as the worst of the "Great Recession".
The third graph shows the employment population ratio and the participation rate.
 The Labor Force Participation Rate decreased to 61.6% in May, from 61.7% in April. This is the percentage of the working age population in the labor force.
 The Employment-Population ratio increased to 58.0% from 57.9% (black line).
I'll post the 25 to 54 age group employment-population ratio graph later.
 The fourth graph shows the unemployment rate.
 The unemployment rate decreased in May to 5.8% from 6.1% in April.
This was below consensus expectations, however March and April were revised up by 27,000 combined.
I'll have more later ...
Black Knight: Number of Homeowners in COVID-19-Related Forbearance Plans Decreased
by Calculated Risk on 6/04/2021 08:16:00 AM
Note: Both Black Knight and the MBA (Mortgage Bankers Association) are putting out weekly estimates of mortgages in forbearance.
This data is as of June 1st.
From Black Knight: Forbearance Volumes Fall, Continuing Trend of Early-in-the-Month Improvement
Forbearance volumes fell by 71,000 (-3.2%) week-over-week, continuing the trend of early-in-the-month declines. Decreases were seen across all investor classes, with GSE forbearances falling by 26K (-3.8%), FHA/VA forbearances falling by 28K (-3.2%) and portfolio/PLS plans declining by 17K (-2.7%) over the past seven days.
With 65,000 plans still listed with May 2020 expirations, opportunity for an additional modest decline remains for next week as well. Some 700,000 plans are listed with June expirations, marking the final quarterly review for early forbearance entrants before they reach their 18-month expirations later this year.
Click on graph for larger image.
Plan starts saw their lowest weekly total since the onset of the pandemic, with both new forbearance starts and well as restarts both seeing noticeable declines this week. Another mark of the improvement seen this week: plan exits hit their highest level in four weeks, driven by plan expirations/reviews taking place at the end of May.
Given the large review volumes on the horizon, it will be worth keeping a close eye on exit activity in coming weeks – most acutely in the first week of July. As of June 1, 2.12 million (4.0% of) homeowners remain in pandemic-related forbearance plans, including 2.4% of GSE, 7.1% of FHA/VA and 4.7% of portfolio/PLS loans.
emphasis added

Thursday, June 03, 2021
Friday: Employment Report
by Calculated Risk on 6/03/2021 09:00:00 PM
My May Employment Preview
Goldman May Payrolls Preview
Friday:
• At 7:00 AM ET, Speech, Fed Chair Jerome Powell, Central banks and climate change, At the Green Swan 2021 Global Virtual Conference
• At 8:30 AM, Employment Report for May. The consensus is for 650,000 jobs added, and for the unemployment rate to decrease to 5.9%. There were 266,000 jobs added in April, and the unemployment rate was at 6.1%.


