 RSS Feed
 by Calculated Risk on 5/04/2021 02:46:00 PM
Tuesday, May 04, 2021
U.S. Heavy Truck Sales up Sharply Year-over-year in April
The following graph shows heavy truck sales since 1967 using data from the BEA. The dashed line is the April 2021 seasonally adjusted annual sales rate (SAAR).
Heavy truck sales really collapsed during the great recession, falling to a low of 180 thousand SAAR in May 2009. Then heavy truck sales increased to a new all time high of 575 thousand SAAR in September 2019.
However heavy truck sales started declining in late 2019 due to lower oil prices.
Note: "Heavy trucks - trucks more than 14,000 pounds gross vehicle weight."

Click on graph for larger image.
Heavy truck sales really declined towards the end of March 2020 due to COVID-19 and the collapse in oil prices, falling to a low of 299 thousand SAAR in May 2020, but have since rebounded.
Heavy truck sales were at 499 thousand SAAR in April, down from 517 thousand SAAR in March, but up 46% from 390 thousand SAAR in March 2020.
The year-over-year comparison are easy for the next few months because of the collapse in sales in the early months of the pandemic.
Black Knight Mortgage Monitor for March
by Calculated Risk on 5/04/2021 10:45:00 AM
Black Knight released their Mortgage Monitor report for March yesterday. According to Black Knight, 5.02% of mortgages were delinquent in March, down from 6.00% of mortgages in February, and up from 3.39% in March 2020. Black Knight also reported that 0.30% of mortgages were in the foreclosure process, down from 0.42% a year ago.
This gives a total of 5.44% delinquent or in foreclosure.
Press Release: Inflow of New Mortgage Delinquencies Drops to Record Low in March; April Payment Data Suggests Further Improvement Likely
Today, the Data & Analytics division of Black Knight, Inc. released its latest Mortgage Monitor Report, based upon the company’s industry-leading mortgage, real estate and public records datasets. In light of March’s 16.4% decline in delinquencies – as reported in Black Knight’s First Look at the month’s data – this month’s report drills deeper into what that may mean for the market. According to Black Knight Data & Analytics President Ben Graboske, both the company’s full-month data for March and its unique McDash Flash daily performance tracking data for April suggest strengthening economic trends are now manifesting in the mortgage market.
Not only did March see the largest single-month improvement in delinquencies in 11 years, but all indications suggest more is yet to come,” said Graboske. “Several factors contributed to particularly strong mortgage performance in March, including the distribution of 159 million stimulus payments totaling more than $376 billion, broader economic improvement leading to nearly a million new jobs and 1.2 million forbearance plans reviewed for extension or removal, resulting in an 11% decline in plan volumes in the last 30 days. As many early forbearance plan adopters shifted to post-forbearance waterfalls to get back to performing on their mortgage payments, inflow has continued to steadily improve as well. And, of the 7.1 million homeowners who have been in COVID-19 forbearance at one point or another, performance among those who have left plans has generally been strong.
“Some other key metrics also point to a robust recovery under way. Despite mortgage delinquencies tending to trend seasonally upward starting in April, our McDash Flash daily performance dataset instead shows strong early payment activity for the month. Through April 23, 91.6% of mortgage holders had made their monthly payments, up from 91% in March and the largest share for any month since the onset of the pandemic. That said, while overall sentiment for an economic recovery in 2021 remains robust, mortgage performance is expected to run into seasonal headwinds for most of the remainder of the year, which could marginally dampen overall improvement rates. Black Knight will continue to monitor the situation as we move forward.”
emphasis added
 Click on graph for larger image.
Here is a graph from the Mortgage Monitor that shows Credit Scores of rate locks.
From Black Knight:
Interesting trends are being seen among credit scores of both purchase and refinance rate locks in recent months
• After seeing credit scores among both purchases and refinances hit all-time highs in 2020, credits scores specifically among refinances have begun to wain early this year
• This type of behavior is typical in a rising rate environment as high credit score borrowers tend to be the first to jump in and refinance when rates fall and the first to exit the market as rates begin to rise
• The average credit score among rate/term refinances is down 13 points year to date, while the average among cash out refis is down a more modest 8 points
• At the same time, credit quality among purchase loans continues to remain strong with the average credit score of purchase locks up 3 points through March 2021 from 2020's already record highs
 And on delinquencies from Black Knight:
 • March saw the largest monthly decline among delinquencies in 11 years, and the second-largest monthly improvement ever recordedThere is much more in the mortgage monitor.
• March delinquency drops are common, accounting for 17 of the 19 largest monthly declines in recent history
• This month saw even more robust improvement than average due to both January and February ending on Sundays – which tends to dampen performance and then lead to “bounce back” gains – as well as broader economic improvements
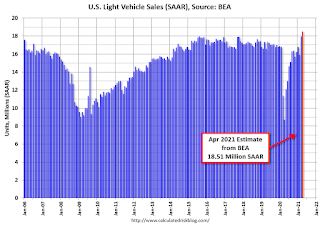
April Vehicles Sales increased to 18.51 Million SAAR; Highest Since 2005
by Calculated Risk on 5/04/2021 08:54:00 AM
The BEA released their estimate of light vehicle sales for April this morning. The BEA estimates sales of 18.51 million SAAR in April 2021 (Seasonally Adjusted Annual Rate), up 3.1% from the March sales rate, and up more than double from April 2020.
This was the highest sales rate since 2005.
This was above the consensus estimate.
 Click on graph for larger image.
This graph shows light vehicle sales since 2006 from the BEA (blue) and the BEA's estimate for April (red).
The impact of COVID-19 was significant, and April 2020 was the worst month.
Since April 2020, sales have increased are now up compared to 2019.
 Click on graph for larger image.
This graph shows light vehicle sales since 2006 from the BEA (blue) and the BEA's estimate for April (red).
The impact of COVID-19 was significant, and April 2020 was the worst month.
Since April 2020, sales have increased are now up compared to 2019.
Sales-to-date are up 1.9% compared to the same period in 2019.
The second graph shows light vehicle sales since the BEA started keeping data in 1967.
 Note: dashed line is current estimated sales rate of 18.51 million SAAR.
The second graph shows light vehicle sales since the BEA started keeping data in 1967.
 Note: dashed line is current estimated sales rate of 18.51 million SAAR.
Sales in April were positively impacted by the American Rescue Plan Act.
Trade Deficit Increased to $74.4 Billion in March
by Calculated Risk on 5/04/2021 08:38:00 AM
From the Department of Commerce reported:
The U.S. Census Bureau and the U.S. Bureau of Economic Analysis announced today that the goods and services deficit was $74.4 billion in March, up $3.9 billion from $70.5 billion in February, revised.
March exports were $200.0 billion, $12.4 billion more than February exports. March imports were $274.5 billion, $16.4 billion more than February imports.
emphasis added
 Click on graph for larger image.
Both exports and imports increased in March.
Exports are up 8.1% compared to March 2020; imports are up 18.1% compared to March 2020.
Both imports and exports decreased sharply due to COVID-19, and have now bounced back (imports much more than exports),
The second graph shows the U.S. trade deficit, with and without petroleum.
 The blue line is the total deficit, and the black line is the petroleum deficit, and the red line is the trade deficit ex-petroleum products.
Note that net, imports and exports of petroleum products are close to zero.
The trade deficit with China increased to $27.7 billion in March, from $11.8 billion in March 2020.
CoreLogic: House Prices up 11.3% Year-over-year in March
by Calculated Risk on 5/04/2021 08:00:00 AM
Notes: This CoreLogic House Price Index report is for March. The recent Case-Shiller index release was for February. The CoreLogic HPI is a three month weighted average and is not seasonally adjusted (NSA).
From CoreLogic: Millennials Propel Home Buying: Strong Demand and Short Supply Push US Home Prices Higher in March, CoreLogic Reports
CoreLogic® ... today released the CoreLogic Home Price Index (HPI™) and HPI Forecast™ for March 2021.
As consumer confidence rebounds and the job market picks back up, the 2021 spring homebuying season is on track to outpace trends seen in 2019 and 2018. Millennials lead the homebuying charge with older millennials seeking move-up purchases and younger millennials entering peak homebuying years. As we look towards the second half of the year, further erosion of affordability may dampen purchase demand as prospective buyers continue to compete for the severely limited supply of for-sale homes. A pick-up in construction and an increase in for-sale listings as more people get vaccinated may help moderate surging home price growth.
“Despite the severe slowdown last year, the 2021 spring homebuying season is trending strong — reflecting the many positive signs of economic recovery,” said Frank Martell, president and CEO of CoreLogic. “With prospective buyers continuing to be motivated by historically low mortgage rates, we anticipate sustained demand in the summer and early fall."
...
Nationally, home prices increased 11.3% in March 2021, compared with March 2020. On a month-over-month basis, home prices increased by 2% compared to February 2021.
“Lower-priced homes are in big demand and short supply, driving up prices faster compared to their more expensive counterparts,” said Dr. Frank Nothaft, chief economist at CoreLogic. “First-time buyers seeking a starter home priced 25% or more below the local-area median saw prices jump 15.1% during the past year, compared with the overall 11.3% gain in our national index."
emphasis added
Monday, May 03, 2021
Tuesday: Trade Deficit
by Calculated Risk on 5/03/2021 09:00:00 PM
From Matthew Graham at Mortgage News Daily: MBS RECAP: Logical Reaction to Data Sets Stage For Interesting Week
The week began with bond markets reacting to weaker economic data with a logical rally. That's the sort of quintessential connection that's been fairly elusive for most of the post-pandemic era. Last month's super strong jobs report (and subsequent bond losses) suggested that trend may be changing. ... [30 year fixed 3.10%]Tuesday:
emphasis added
• At 8:00 AM ET, Corelogic House Price index for March.
• At 8:30 AM, Trade Balance report for March from the Census Bureau. The consensus is the trade deficit to be $74.0 billion. The U.S. trade deficit was at $71.1 Billion in February.
May 3rd COVID-19 Vaccinations, New Cases, Hospitalizations
by Calculated Risk on 5/03/2021 06:33:00 PM
Note: I'm looking forward to not posting this daily! I've been posting this data daily for over a year, and I'll stop once all three of these criteria are met:
1) 70% of the population over 18 has had at least one dose of vaccine, and
2) new cases are under 5,000 per day, and
3) hospitalizations are below 3,000.
According to the CDC, 246.8 million doses have been administered. 40.6% of the population over 18 is fully vaccinated, and 56.3% of the population over 18 has had at least one dose (145.3 million people over 18 have had at least one dose).
And check out COVID Act Now to see how each state is doing.
Over 1,000 US deaths were reported so far in May due to COVID.
 Click on graph for larger image.
This graph shows the daily (columns) 7 day average (line) of positive tests reported.
Note: The ups and downs during the Winter surge were related to reporting delays due to the Thanksgiving and Christmas holidays.
This data is from the CDC.
 Click on graph for larger image.
This graph shows the daily (columns) 7 day average (line) of positive tests reported.
Note: The ups and downs during the Winter surge were related to reporting delays due to the Thanksgiving and Christmas holidays.
This data is from the CDC.
The 7-day average is 48,165, down from 49,456 yesterday, and down from the recent peak of 69,881 on April 13, 2021. This is the lowest since October 8, 2020, but well above the post-summer surge low of 34,668.
The second graph shows the number of people hospitalized.
 This data is also from the CDC.
The CDC cautions that due to reporting delays, the area in grey will probably increase.
The second graph shows the number of people hospitalized.
 This data is also from the CDC.
The CDC cautions that due to reporting delays, the area in grey will probably increase.
The current 7-day average is 34,012, down from 36,000 reported yesterday, but well above the post-summer surge low of 23,000.
MBA Survey: "Share of Mortgage Loans in Forbearance Slightly Decreases to 4.47%"
by Calculated Risk on 5/03/2021 04:00:00 PM
Note: This is as of April 25th.
From the MBA: Share of Mortgage Loans in Forbearance Slightly Decreases to 4.47%
The Mortgage Bankers Association’s (MBA) latest Forbearance and Call Volume Survey revealed that the total number of loans now in forbearance decreased by 2 basis points from 4.49% of servicers’ portfolio volume in the prior week to 4.47% as of April 25, 2021. According to MBA’s estimate, 2.23 million homeowners are in forbearance plans.
The share of Fannie Mae and Freddie Mac loans in forbearance decreased 2 points to 2.42%. Ginnie Mae loans in forbearance decreased 7 basis points to 6.02%, while the forbearance share for portfolio loans and private-label securities (PLS) increased by 13 basis points to 8.55%. The percentage of loans in forbearance for independent mortgage bank (IMB) servicers decreased 2 basis points to 4.70%, and the percentage of loans in forbearance for depository servicers also declined 2 basis points to 4.62%.
"The share of loans in forbearance decreased for the ninth straight week, dropping by 2 basis points. The rate of exits has slowed the past two weeks, with this week’s exit rate reaching the lowest since February,” said Mike Fratantoni, MBA’s Senior Vice President and Chief Economist. “The increase in the forbearance share for portfolio and PLS loans highlights both the ongoing buyouts of delinquent loans from Ginnie Mae pools as well as an increased forbearance share for other loans that are not federally backed.”
Added Fratantoni, “Job market and housing market data remain strong. We expect that further gains in hiring will help to support many homeowners as they exit forbearance in the months ahead.”
emphasis added
 Click on graph for larger image.
This graph shows the percent of portfolio in forbearance by investor type over time. Most of the increase was in late March and early April, and has trended down since then.
The MBA notes: "Total weekly forbearance requests as a percent of servicing portfolio volume (#) decreased relative to the prior week: from 0.06% to 0.05%."
Fed Survey: Banks reported Eased Standards, Increased Demand for Residential Real Estate Loans
by Calculated Risk on 5/03/2021 02:13:00 PM
From the Federal Reserve: The April 2021 Senior Loan Officer Opinion Survey on Bank Lending Practices
Regarding loans to businesses, respondents to the April survey indicated that, on balance, they eased their standards on commercial and industrial (C&I) loans to firms of all sizes over the first quarter. Banks reported weaker demand, on net, for C&I loans to large and middle-market firms, and demand for C&I loans from small firms remained basically unchanged. Standards on commercial real estate (CRE) loans secured by nonfarm nonresidential properties remained basically unchanged, while banks tightened standards on construction and land development loans and eased standards on multifamily loans. Banks reported stronger demand for construction and land development and multifamily loans and reported weaker demand for nonfarm nonresidential loans.
For loans to households, banks eased standards across most categories of residential real estate (RRE) loans, on net, and reported stronger demand for most types of RRE loans over the first quarter. Banks also eased standards across all three consumer loan categories—credit card loans, auto loans, and other consumer loans. Meanwhile, demand for credit card and other consumer loans remained basically unchanged, and demand for auto loans moderately strengthened.
emphasis added
 Click on graph for larger image.
This graph on Residnetial Real Estate lending is from the Senior Loan Officer Survey Charts.
This shows that banks have eased standards (tightened for subprime), and that there is increased demand for RRE loans.
Housing Inventory May 3rd Update: At Record Lows
by Calculated Risk on 5/03/2021 10:39:00 AM
One of the key questions for 2021 is: Will inventory increase as the pandemic subsides, or will inventory decrease further in 2021?
Tracking inventory will be very important this year.
 Click on graph for larger image in graph gallery.
This inventory graph is courtesy of Altos Research.
As of April 30th, inventory was at 307 thousand (7 day average), compared to 738 thousand the same week a year ago. That is a decline of 58%.
A week ago, inventory was at 310 thousand, and was down 58% YoY. Seasonally, inventory might be at a bottom - this is the same level as three weeks ago at 307 thousand.
Mike Simonsen discusses this data regularly on Youtube.
Mike Simonsen discusses this data regularly on Youtube.


