 RSS Feed
 by Calculated Risk on 1/22/2021 10:13:00 AM
Friday, January 22, 2021
NAR: Existing-Home Sales Increased to 6.76 million in December
From the NAR: Existing-Home Sales Rise 0.7% in December, Annual Sales See Highest Level Since 2006
Existing-home sales rose in December, with home sales in 2020 reaching their highest level since 2006, according to the National Association of Realtors®. Activity in the major regions was mixed on a month-over-month basis, but each of the four areas recorded double-digit year-over-year growth in December.
Total existing-home sales, completed transactions that include single-family homes, townhomes, condominiums and co-ops, increased 0.7% from November to a seasonally-adjusted annual rate of 6.76 million in December. Sales in total rose year-over-year, up 22.2% from a year ago (5.53 million in December 2019).
...
Total housing inventory at the end of December totaled 1.07 million units, down 16.4% from November and down 23% from one year ago (1.39 million). Unsold inventory sits at an all-time low 1.9-month supply at the current sales pace, down from 2.3 months in November and down from the 3.0-month figure recorded in December 2019. NAR first began tracking the single-family home supply in 1982.
emphasis added
 Click on graph for larger image.
This graph shows existing home sales, on a Seasonally Adjusted Annual Rate (SAAR) basis since 1993.
Sales in December (6.76 million SAAR) were up 0.7% from last month, and were 22.2% above the December 2019 sales rate.
The second graph shows nationwide inventory for existing homes.
 According to the NAR, inventory decreased to 1.07 million in December from 1.28 million in December. Headline inventory is not seasonally adjusted, and inventory usually decreases to the seasonal lows in December and January, and peaks in mid-to-late summer.
The last graph shows the year-over-year (YoY) change in reported existing home inventory and months-of-supply. Since inventory is not seasonally adjusted, it really helps to look at the YoY change. Note: Months-of-supply is based on the seasonally adjusted sales and not seasonally adjusted inventory.
 Inventory was down 23% year-over-year in December compared to December 2019.
 Months of supply decreased to 1.9 months in December (an all time low).
This was above the consensus forecast. I'll have more later.
Black Knight: National Mortgage Delinquency Rate Decreased in December
by Calculated Risk on 1/22/2021 08:00:00 AM
Note: Loans in forbearance are counted as delinquent in this survey, but those loans are not reported as delinquent to the credit bureaus.
From Black Knight: Black Knight’s First Look: 2020 Ends With 1.7 Million More Seriously Delinquent Homeowners Than at Start of Year; Foreclosures at Record Low
• The year ended with 1.54 million more delinquent and 1.7 million more seriously delinquent mortgages than at the start of 2020, a looming reminder of the challenges facing the market in 2021According to Black Knight's First Look report, the percent of loans delinquent decreased 3.9% in December compared to November, and increased 79% year-over-year.
• Despite the year-over-year increase, the national delinquency rate saw modest improvement in December, falling by 3.9% from November to 6.08%, the lowest level since April 2020
• Serious delinquencies (loans 90 or more days past due) also improved, falling to 2.15 million from 2.19 million the month prior
• Even after months of improvement, 90-day default activity rose by more than 250% (+2.6 million) overall in 2020
• Foreclosure starts fell by 67% from the year prior and the year’s 40,000 foreclosure sales (completions) represented an annual decline of more than 70%
• Starts and sales have hit record lows as moratoriums and forbearance plans protect distressed homeowners from facing foreclosure in the wake of the pandemic
• Prepayment activity rose by 12% percent in December, ending the year 112% higher than the same month in 2019 and highlighting a still-strong refinance market entering 2021
emphasis added
The percent of loans in the foreclosure process increased 1.3% in December and were down 28% over the last year.
Black Knight reported the U.S. mortgage delinquency rate (loans 30 or more days past due, but not in foreclosure) was 6.08% in December, down from 6.33% in November.
The percent of loans in the foreclosure process increased slightly in December to 0.33%, from 0.33% in November.
The number of delinquent properties, but not in foreclosure, is up 1,448,000 properties year-over-year, and the number of properties in the foreclosure process is down 67,000 properties year-over-year.
| Black Knight: Percent Loans Delinquent and in Foreclosure Process | ||||
|---|---|---|---|---|
| Dec 2020 | Nov 2020 | Dec 2019 | Dec 2018 | |
| Delinquent | 6.08% | 6.33% | 3.40% | 3.88% |
| In Foreclosure | 0.33% | 0.33% | 0.46% | 0.52% |
| Number of properties: | ||||
| Number of properties that are delinquent, but not in foreclosure: | 3,251,000 | 3,381,000 | 1,803,000 | 2,013,000 |
| Number of properties in foreclosure pre-sale inventory: | 178,000 | 176,000 | 245,000 | 271,000 |
| Total Properties | 3,429,000 | 3,557,000 | 2,047,000 | 2,283,000 |
Thursday, January 21, 2021
Friday: Existing Home Sales
by Calculated Risk on 1/21/2021 09:18:00 PM
Friday:
• At 10:00 AM ET, Existing Home Sales for December from the National Association of Realtors (NAR). The consensus is for 6.55 million SAAR, down from 6.69 million.
Housing economist Tom Lawler estimates the NAR will report sales of 6.62 million SAAR for December.
January 21 COVID-19 Test Results and Vaccinations
by Calculated Risk on 1/21/2021 07:28:00 PM
Note: Bloomberg has great data on vaccinations.
It is possible the 7-day average cases has peaked. Stay safe! I'm looking forward to not posting this data in a few months.
"Vaccinations in the U.S. began Dec. 14 with health-care workers, and so far 18.4 million shots have been given, according to a state-by-state tally by Bloomberg and data from the Centers for Disease Control and Prevention. In the last week, an average of 939,973 doses per day were administered."Also check out the graphs at COVID-19 Vaccine Projections The site has several interactive graphs related to US COVID vaccinations including a breakdown of how many have had one shot, and how many have had both shots.
It is possible the 7-day average cases has peaked. Stay safe! I'm looking forward to not posting this data in a few months.
The US is now averaging close to 2 million tests per day. Based on the experience of other countries, for adequate test-and-trace (and isolation) to reduce infections, the percent positive needs to be under 5% (probably close to 1%), so the US has far too many daily cases - and percent positive - to do effective test-and-trace.
There were 1,919,138 test results reported over the last 24 hours.
There were 184,864 positive tests.
Almost 64,000 US deaths have been reported so far in January. See the graph on US Daily Deaths here.
 Click on graph for larger image.
This data is from the COVID Tracking Project.
The percent positive over the last 24 hours was 9.6% (red line is 7 day average). The percent positive is calculated by dividing positive results by total tests (including pending).
And check out COVID Act Now to see how each state is doing. (updated link to new site)
 The second graph shows the 7 day average of positive tests reported and daily hospitalizations.
It is possible cases and hospitalizations have peaked, but are still at a very high level.
Hotels: Occupancy Rate Declined 31.8% Year-over-year
by Calculated Risk on 1/21/2021 01:07:00 PM
U.S. weekly hotel occupancy climbed back to the 40% mark, according to STR‘s latest data through 16 January.The following graph shows the seasonal pattern for the hotel occupancy rate using the four week average.
10-16 January 2021 (percentage change from comparable week in 2020):
• Occupancy: 40.1% (-31.8%)
• Average daily rate (ADR): US$89.39 (-31.9%)
• evenue per available room (RevPAR): US$35.85 (-53.6%)
emphasis added
 Click on graph for larger image.
The red line is for 2021, black is 2020, blue is the median, and dashed light blue is for 2009 (the worst year since the Great Depression for hotels prior to 2020).
Even when occupancy increases to 2009 levels, hotels will still be hurting.
Seasonally we'd expect that business travel would start to pick up in the new year, but there will probably not be much pickup early in 2021.
Note: Y-axis doesn't start at zero to better show the seasonal change.
Seasonally we'd expect that business travel would start to pick up in the new year, but there will probably not be much pickup early in 2021.
Note: Y-axis doesn't start at zero to better show the seasonal change.
Comments on December Housing Starts
by Calculated Risk on 1/21/2021 11:26:00 AM
Earlier: Housing Starts increased to 1.669 Million Annual Rate in December
Total housing starts in December were above expectations, and starts in October and November were revised up. The single family sectors has increased sharply, but the volatile multi-family sector is down significantly year-over-year (apartments are under pressure from COVID).
The housing starts report showed starts were up 5.8% in December compared to November, and starts were up 5.2% year-over-year compared to December 2019.
Single family starts were up 28% year-over-year. Single family starts are at the highest level since 2006. Low mortgage rates and limited existing home inventory have given a boost to single family housing starts.
The first graph shows the month to month comparison for total starts between 2019 (blue) and 2020 (red). A key point: Housing starts averaged 1.590 million SAAR in the three months prior to the pandemic. That is about the same as the last three months. 2020 was off to a strong start before the pandemic, and with low interest rates and little competing existing home inventory, starts finished the year strong.
 Click on graph for larger image.
Starts were up 5.2% in December compared to December 2019.
In 2019, starts picked up at the end of the year - and were strong in early 2020 - so the comparisons for the next couple of months will be difficult - and then the comparisons will be easy in March, April and May. Don't be surprised if starts are down year-over-year sometime over the next two months.
Starts were up 7.0% in 2020 from 2019. This is close to my forecast for 2020, although I didn't expect a pandemic!
I expect starts to remain solid, but the growth rate will slow.
Below is an update to the graph comparing multi-family starts and completions. Since it usually takes over a year on average to complete a multi-family project, there is a lag between multi-family starts and completions. Completions are important because that is new supply added to the market, and starts are important because that is future new supply (units under construction is also important for employment).
These graphs use a 12 month rolling total for NSA starts and completions.
 The blue line is for multifamily starts and the red line is for multifamily completions.
The rolling 12 month total for starts (blue line) increased steadily for several years following the great recession - then mostly moved sideways. Completions (red line) had lagged behind - then completions caught up with starts- then starts picked up a little again late last year, but have fallen off with the pandemic.
 The last graph shows single family starts and completions. It usually only takes about 6 months between starting a single family home and completion - so the lines are much closer. The blue line is for single family starts and the red line is for single family completions.
Single family starts are getting back to more normal levels, and I expect some further increases in single family starts and completions on a rolling 12 month basis.
Housing Starts increased to 1.669 Million Annual Rate in December
by Calculated Risk on 1/21/2021 08:47:00 AM
From the Census Bureau: Permits, Starts and Completions
Housing Starts:
Privately-owned housing starts in December were at a seasonally adjusted annual rate of 1,669,000. This is 5.8 percent above the revised November estimate of 1,578,000 and is 5.2 percent above the December 2019 rate of 1,587,000. Single-family housing starts in December were at a rate of 1,338,000; this is 12.0 percent above the revised November figure of 1,195,000. The December rate for units in buildings with five units or more was 312,000.
An estimated 1,380,300 housing units were started in 2020. This is 7.0 percent above the 2019 figure of 1,290,000.
Building Permits:
Privately-owned housing units authorized by building permits in December were at a seasonally adjusted annual rate of 1,709,000. This is 4.5 percent above the revised November rate of 1,635,000 and is 17.3 percent above the December 2019 rate of 1,457,000. Single-family authorizations in December were at a rate of 1,226,000; this is 7.8 percent above the revised November figure of 1,137,000. Authorizations of units in buildings with five units or more were at a rate of 437,000 in December.
emphasis added
 Click on graph for larger image.
The first graph shows single and multi-family housing starts for the last several years.
Multi-family starts (red, 2+ units) decreased in December compared to November. Multi-family starts were down 39% year-over-year in December.
Single-family starts (blue) increased in December, and were up 28% year-over-year. This is the highest level for single family starts since 2006.
 The second graph shows total and single unit starts since 1968.
 The second graph shows the huge collapse following the housing bubble, and then eventual recovery (but still historically low).
Total housing starts in December were above expectations, and starts in October and November were revised up. A very strong report.
I'll have more later …
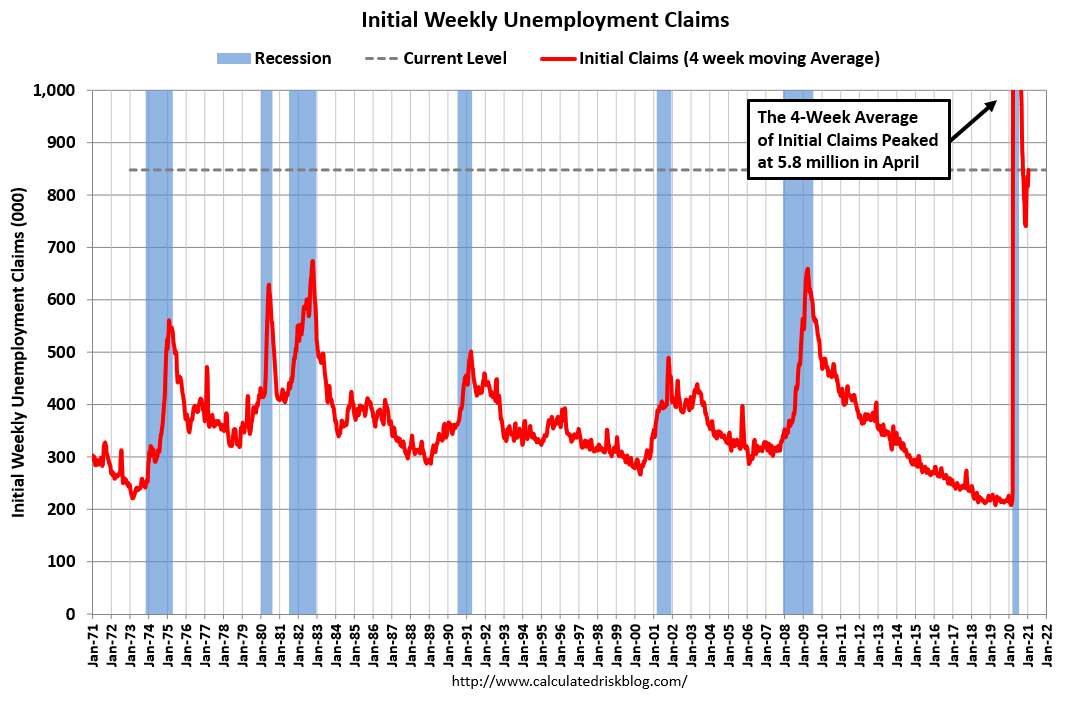
Weekly Initial Unemployment Claims decreased to 900,000
by Calculated Risk on 1/21/2021 08:37:00 AM
The DOL reported:
In the week ending January 16, the advance figure for seasonally adjusted initial claims was 900,000, a decrease of 26,000 from the previous week's revised level. The previous week's level was revised down by 39,000 from 965,000 to 926,000. The 4-week moving average was 848,000, an increase of 23,500 from the previous week's revised average. The previous week's average was revised down by 9,750 from 834,250 to 824,500.This does not include the 423,734 initial claims for Pandemic Unemployment Assistance (PUA) that was up from 284,886 the previous week.
emphasis added
The following graph shows the 4-week moving average of weekly claims since 1971.
 Click on graph for larger image.
The dashed line on the graph is the current 4-week average. The four-week average of weekly unemployment claims increased to 848,000.
The previous week was revised down.
The second graph shows seasonally adjust continued claims since 1967 (lags initial by one week).
 At the worst of the Great Recession, continued claims peaked at 6.635 million, but then steadily declined.
Regular state continued claims decreased to 5,054,000 (SA) from 5,181,000 (SA) the previous week and will likely stay at a high level until the crisis abates.
Note: There are an additional 5,707,397 receiving Pandemic Unemployment Assistance (PUA) that decreased from 7,442,888 the previous week (there are questions about these numbers). This is a special program for business owners, self-employed, independent contractors or gig workers not receiving other unemployment insurance.
An additional 3,026,952 are receiving Pandemic Emergency Unemployment Compensation (PEUC) that decreased from 4,166,261 the previous week. These numbers will increase now that the programs have been extended.
Wednesday, January 20, 2021
Thursday: Housing Starts, Unemployment Claims, Philly Fed Mfg
by Calculated Risk on 1/20/2021 09:11:00 PM
Thursday:
• At 8:30 AM ET, The initial weekly unemployment claims report will be released. The consensus is for a decrease to 910 thousand from 965 thousand last week.
• Also at 8:30 AM, Housing Starts for December. The consensus is for 1.560 million SAAR, up from 1.547 million SAAR.
• Also at 8:30 AM, the Philly Fed manufacturing survey for January. The consensus is for a reading of 12.3, up from 9.1.
January 20 COVID-19 Test Results
by Calculated Risk on 1/20/2021 06:51:00 PM
Note: Bloomberg has great data on vaccinations.
"Vaccinations in the U.S. began Dec. 14 with health-care workers, and so far 17.2 million shots have been given, according to a state-by-state tally by Bloomberg and data from the Centers for Disease Control and Prevention. In the last week, an average of 912,497 doses per day were administered."It is possible the 7-day average cases has peaked. Stay safe! I'm looking forward to not posting this data in a few months.
The US is now averaging close to 2 million tests per day. Based on the experience of other countries, for adequate test-and-trace (and isolation) to reduce infections, the percent positive needs to be under 5% (probably close to 1%), so the US has far too many daily cases - and percent positive - to do effective test-and-trace.
There were 1,788,698 test results reported over the last 24 hours.
There were 185,822 positive tests.
Over 60,000 US deaths have been reported so far in January. See the graph on US Daily Deaths here.
 Click on graph for larger image.
This data is from the COVID Tracking Project.
The percent positive over the last 24 hours was 10.4% (red line is 7 day average). The percent positive is calculated by dividing positive results by total tests (including pending).
And check out COVID Act Now to see how each state is doing. (updated link to new site)
 The second graph shows the 7 day average of positive tests reported and daily hospitalizations.
It is possible cases and hospitalizations have peaked, but are still at a very high level.


