 RSS Feed
 by Calculated Risk on 1/15/2021 12:36:00 PM
Friday, January 15, 2021
Q4 GDP Forecasts
From Merrrill Lynch:
We revise up 1Q 2021 GDP growth to 4.0% qoq saar from 1.0%, but take down 2Q to 5.0% from 7.0%, reflecting the earlier passage of stimulus in December. This leaves annual 2021 growth at 5.0% from 4.6% previously, with risks tilted to the upside if additional stimulus makes it through Washington in coming months. We continue to track 5.0% qoq saar for 4Q 2020 GDP. [Jan 15 estimate] emphasis addedFrom the NY Fed Nowcasting Report
The New York Fed Staff Nowcast stands at 2.5% for 2020:Q4 and 6.2% for 2021:Q1. [Jan 15 estimate]And from the Altanta Fed: GDPNow
The GDPNow model estimate for real GDP growth (seasonally adjusted annual rate) in the fourth quarter of 2020 is 7.4 percent on January 15, down from 8.7 percent on January 8. [Jan 15 estimate]
CAR on California December Housing: Sales up 28% YoY, Active Listings down 47% YoY
by Calculated Risk on 1/15/2021 11:41:00 AM
The CAR reported: California housing market ends year on high note as sales continue strong in December and median price reaches another record high, C.A.R. reports
Despite a global pandemic that lingered most of the year, two lockdowns and a struggling economy, California’s housing market closed out 2020 on a high note, recording solid sales and a fifth record-high median price in December, the CALIFORNIA ASSOCIATION OF REALTORS® (C.A.R.) said today.CR Note: Existing home sales are reported when the transaction closes, so this was mostly for contracts signed in October and November.
Closed escrow sales of existing, single-family detached homes in California totaled a seasonally adjusted annualized rate of 509,750 units in December, according to information collected by C.A.R. from more than 90 local REALTOR® associations and MLSs statewide. The statewide annualized sales figure represents what would be the total number of homes sold during 2020 if sales maintained the December pace throughout the year. It is adjusted to account for seasonal factors that typically influence home sales.
December home sales ticked up 0.2 percent from 508,820 in November and were up 28 percent from a year ago, when 398,370 homes were sold on an annualized basis. The year-over-year, double-digit sales gain was the fifth consecutive and the largest yearly gain since May 2009. For the year as a whole, annual home sales rose to a preliminary 411,870 closed escrow sales in California, up 3.5 percent from 2019’s pace of 397,960.
...
“Home prices, which usually peak during the summer, were unseasonably strong in December,” said C.A.R. Vice President and Chief Economist Jordan Levine. “The imbalance between supply and demand continues to fuel home price gains as would-be home sellers remain reluctant to list their homes during the pandemic, contributing to a more-than-40-percent year-over-year decline in active listings for the seventh straight month.”
...
Active listings fell 47.1 percent from last year and continued to drop more than 40 percent on a year-over-year basis for the seventh straight month. On a month-to-month basis, for-sale properties dropped 18.6 percent in December, higher than the 5-year average of -14.0 percent, observed between 2015 and 2019.
emphasis added
Industrial Production Increased 1.6 Percent in December; 3.3% Below Pre-Crisis Level
by Calculated Risk on 1/15/2021 09:22:00 AM
From the Fed: Industrial Production and Capacity Utilization
Industrial production advanced 1.6 percent in December, with gains of 0.9 percent for manufacturing, 1.6 percent for mining, and 6.2 percent for utilities. The increase for utilities resulted from a rebound in demand for heating after unseasonably warm weather in November. For the fourth quarter as a whole, total industrial production rose at an annual rate of 8.4 percent. At 105.7 percent of its 2012 average, total industrial production in December was 3.6 percent lower than it was a year earlier and 3.3 percent below its pre-pandemic February reading. Capacity utilization for the industrial sector rose 1.1 percentage points in December to 74.5 percent, a rate that is 5.3 percentage points below its long-run (1972–2019) average.
emphasis added
 Click on graph for larger image.
This graph shows Capacity Utilization. This series is up from the record low set in April, but still below the level in February 2020.
Capacity utilization at 74.5% is 5.3% below the average from 1972 to 2019.
Note: y-axis doesn't start at zero to better show the change.
 The second graph shows industrial production since 1967.
Industrial production increased in December to 105.7. This is 3.3% below the February 2020 level.
The change in industrial production was above consensus expectations, and industrial production in October and November were revised up slightly.
Retail Sales decreased 0.7% in December
by Calculated Risk on 1/15/2021 08:38:00 AM
On a monthly basis, retail sales decreased 0.7 percent from November to December (seasonally adjusted), and sales were up 2.9 percent from December 2019.
From the Census Bureau report:
Advance estimates of U.S. retail and food services sales for December 2020, adjusted for seasonal variation and holiday and trading-day differences, but not for price changes, were $540.9 billion, a decrease of 0.7 percent from the previous month, but 2.9 percent above December 2019. Total sales for the 12 months of 2020 were up 0.6 percent from 2019. ... The October 2020 to November 2020 percent change was revised from down 1.1 percent to down 1.4 percent.
emphasis added
 Click on graph for larger image.
This graph shows retail sales since 1992. This is monthly retail sales and food service, seasonally adjusted (total and ex-gasoline).
Retail sales ex-gasoline were down 1.2% in December.
The second graph shows the year-over-year change in retail sales and food service (ex-gasoline) since 1993.
 Retail and Food service sales, ex-gasoline, increased by 4.2% on a YoY basis.
The decrease in December was slightly above expectations, however sales in October and November were revised down.
Thursday, January 14, 2021
Friday: Retail Sales, Industrial Production, NY Fed Mfg, PPI
by Calculated Risk on 1/14/2021 09:17:00 PM
Friday:
• At 8:30 AM ET, Retail sales for December is scheduled to be released. The consensus is for a 0.2% decrease in retail sales.
• Also at 8:30 AM, The Producer Price Index for December from the BLS. The consensus is for a 0.3% increase in PPI, and a 0.2% increase in core PPI.
• Also at 8:30 AM, The New York Fed Empire State manufacturing survey for January. The consensus is for a reading of 5.5, up from 4.9.
• At 9:15 AM, The Fed will release Industrial Production and Capacity Utilization for December. The consensus is for a 0.4% increase in Industrial Production, and for Capacity Utilization to increase to 73.5%.
• At 10:00 AM, University of Michigan's Consumer sentiment index (Preliminary for January).
January 14 COVID-19 Test Results; Record 7-Day Deaths
by Calculated Risk on 1/14/2021 06:52:00 PM
Note: It is possible the 7-day average cases is nearing a peak. I'm looking forward to not posting this data in a few months.
The US is now averaging close to 2 million tests per day. Based on the experience of other countries, for adequate test-and-trace (and isolation) to reduce infections, the percent positive needs to be under 5% (probably close to 1%), so the US has far too many daily cases - and percent positive - to do effective test-and-trace.
There were 2,010,144 test results reported over the last 24 hours.
There were 222,944 positive tests.
Almost 43,000 US deaths have been reported so far in January. See the graph on US Daily Deaths here.
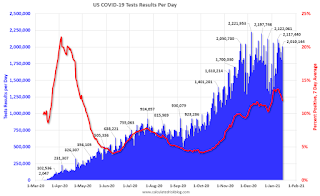 Click on graph for larger image.
This data is from the COVID Tracking Project.
The percent positive over the last 24 hours was 11.1% (red line is 7 day average). The percent positive is calculated by dividing positive results by total tests (including pending).
And check out COVID Act Now to see how each state is doing. (updated link to new site)
 The second graph shows the 7 day average of positive tests reported and daily hospitalizations.
• Record 7-Day Deaths
Leading Index for Commercial Real Estate Increased in December
by Calculated Risk on 1/14/2021 12:34:00 PM
From Dodge Data Analytics: Dodge Momentum Index Ends 2020 on a High Note
The Dodge Momentum Index jumped 9.2% in December to 134.6 (2000=100) from the revised November reading of 123.3. The Momentum Index, issued by Dodge Data & Analytics, is a monthly measure of the first (or initial) report for nonresidential building projects in planning, which have been shown to lead construction spending for nonresidential buildings by a full year. The commercial component of the Momentum Index rose 14.0%, while the institutional component rose by 0.3%.
The gain in the commercial component of the Momentum Index was heartening even though the increase was mostly the result of a sizeable increase in warehouse planning. The warehouse sector has been one of the few areas of construction that has flourished during the pandemic thanks to increased demand for online shopping. For the full year of 2020, the Dodge Momentum Index lost 4.8% from 2019. The institutional component of the Momentum Index dropped 13.5%, while the commercial component increased 0.8%.
emphasis added
 Click on graph for larger image.
This graph shows the Dodge Momentum Index since 2002. The index was at 134.6 in December, up from 123.3 in November.
According to Dodge, this index leads "construction spending for nonresidential buildings by a full year". This index suggests a decline in Commercial Real Estate construction through most of 2021, but maybe some pickup towards the end of the year.
Hotels: Occupancy Rate Declined 28.3% Year-over-year
by Calculated Risk on 1/14/2021 11:02:00 AM
From HotelNewsNow.com: STR: US hotel results for week ending 9 January
U.S. weekly hotel occupancy fell back below the 40% mark, according to STR‘s latest data through 9 January.The following graph shows the seasonal pattern for the hotel occupancy rate using the four week average.
3-9 January 2021 (percentage change from comparable week in 2020):
• Occupancy: 37.0% (-28.3%)
• Average daily rate (ADR): US$87.97 (-27.1%)
• Revenue per available room (RevPAR): US$32.59 (-47.7%)
The previous week’s occupancy was lifted by New Year’s travel. As that holiday travel dissipated, TSA checkpoint counts and hotel room demand each declined by roughly 1.3 million in a week-over-week comparison.
emphasis added
 Click on graph for larger image.
The red line is for 2021, black is 2020, blue is the median, and dashed light blue is for 2009 (the worst year since the Great Depression for hotels - before 2020).
Seasonally we'd expect that business travel would start to pick up in the new year, but there will probably not be much pickup early in 2021.
Note: Y-axis doesn't start at zero to better show the seasonal change.
Weekly Initial Unemployment Claims increased to 965,000
by Calculated Risk on 1/14/2021 08:38:00 AM
The DOL reported:
In the week ending January 9, the advance figure for seasonally adjusted initial claims was 965,000, an increase of 181,000 from the previous week's revised level. The previous week's level was revised down by 3,000 from 787,000 to 784,000. The 4-week moving average was 834,250, an increase of 18,250 from the previous week's revised average. The previous week's average was revised down by 2,750 from 818,750 to 816,000.This does not include the 284,470 initial claims for Pandemic Unemployment Assistance (PUA) that was up from 161,159 the previous week.
emphasis added
The following graph shows the 4-week moving average of weekly claims since 1971.
 Click on graph for larger image.
The dashed line on the graph is the current 4-week average. The four-week average of weekly unemployment claims increased to 834,250.
The previous week was revised down.
The second graph shows seasonally adjust continued claims since 1967 (lags initial by one week).
 At the worst of the Great Recession, continued claims peaked at 6.635 million, but then steadily declined.
Regular state continued claims increased to 5,271,000 (SA) from 5,072,000 (SA) the previous week and will likely stay at a high level until the crisis abates.
Note: There are an additional 7,442,888 receiving Pandemic Unemployment Assistance (PUA) that decreased from 8,383,387 the previous week (there are questions about these numbers). This is a special program for business owners, self-employed, independent contractors or gig workers not receiving other unemployment insurance.
An additional 4,166,261 are receiving Pandemic Emergency Unemployment Compensation (PEUC) that decreased from 4,491,413 the previous week.
Wednesday, January 13, 2021
Thursday: Unemployment Claims, Fed Chair Powell
by Calculated Risk on 1/13/2021 09:49:00 PM
Thursday:
• At 8:30 AM ET, The initial weekly unemployment claims report will be released. The consensus is for an increase to 850 thousand from 787 thousand last week.
• At 12:30 PM, Discussion, Fed Chair Jerome Powell, "A Conversation with Federal Reserve Chair Jerome Powell", At a livestream event hosted by Markus Brunnermerier, Director, Princeton University Bendheim Center for Finance


