 RSS Feed
 by Calculated Risk on 1/14/2021 06:52:00 PM
Thursday, January 14, 2021
January 14 COVID-19 Test Results; Record 7-Day Deaths
Note: It is possible the 7-day average cases is nearing a peak. I'm looking forward to not posting this data in a few months.
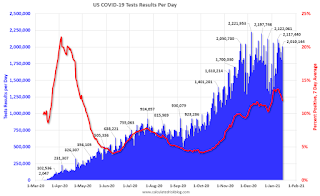
The US is now averaging close to 2 million tests per day. Based on the experience of other countries, for adequate test-and-trace (and isolation) to reduce infections, the percent positive needs to be under 5% (probably close to 1%), so the US has far too many daily cases - and percent positive - to do effective test-and-trace.
There were 2,010,144 test results reported over the last 24 hours.
There were 222,944 positive tests.
Almost 43,000 US deaths have been reported so far in January. See the graph on US Daily Deaths here.
 Click on graph for larger image.
This data is from the COVID Tracking Project.
The percent positive over the last 24 hours was 11.1% (red line is 7 day average). The percent positive is calculated by dividing positive results by total tests (including pending).
And check out COVID Act Now to see how each state is doing. (updated link to new site)
 The second graph shows the 7 day average of positive tests reported and daily hospitalizations.
• Record 7-Day Deaths
Leading Index for Commercial Real Estate Increased in December
by Calculated Risk on 1/14/2021 12:34:00 PM
From Dodge Data Analytics: Dodge Momentum Index Ends 2020 on a High Note
The Dodge Momentum Index jumped 9.2% in December to 134.6 (2000=100) from the revised November reading of 123.3. The Momentum Index, issued by Dodge Data & Analytics, is a monthly measure of the first (or initial) report for nonresidential building projects in planning, which have been shown to lead construction spending for nonresidential buildings by a full year. The commercial component of the Momentum Index rose 14.0%, while the institutional component rose by 0.3%.
The gain in the commercial component of the Momentum Index was heartening even though the increase was mostly the result of a sizeable increase in warehouse planning. The warehouse sector has been one of the few areas of construction that has flourished during the pandemic thanks to increased demand for online shopping. For the full year of 2020, the Dodge Momentum Index lost 4.8% from 2019. The institutional component of the Momentum Index dropped 13.5%, while the commercial component increased 0.8%.
emphasis added
 Click on graph for larger image.
This graph shows the Dodge Momentum Index since 2002. The index was at 134.6 in December, up from 123.3 in November.
According to Dodge, this index leads "construction spending for nonresidential buildings by a full year". This index suggests a decline in Commercial Real Estate construction through most of 2021, but maybe some pickup towards the end of the year.
Hotels: Occupancy Rate Declined 28.3% Year-over-year
by Calculated Risk on 1/14/2021 11:02:00 AM
From HotelNewsNow.com: STR: US hotel results for week ending 9 January
U.S. weekly hotel occupancy fell back below the 40% mark, according to STR‘s latest data through 9 January.The following graph shows the seasonal pattern for the hotel occupancy rate using the four week average.
3-9 January 2021 (percentage change from comparable week in 2020):
• Occupancy: 37.0% (-28.3%)
• Average daily rate (ADR): US$87.97 (-27.1%)
• Revenue per available room (RevPAR): US$32.59 (-47.7%)
The previous week’s occupancy was lifted by New Year’s travel. As that holiday travel dissipated, TSA checkpoint counts and hotel room demand each declined by roughly 1.3 million in a week-over-week comparison.
emphasis added
 Click on graph for larger image.
The red line is for 2021, black is 2020, blue is the median, and dashed light blue is for 2009 (the worst year since the Great Depression for hotels - before 2020).
Seasonally we'd expect that business travel would start to pick up in the new year, but there will probably not be much pickup early in 2021.
Note: Y-axis doesn't start at zero to better show the seasonal change.
Weekly Initial Unemployment Claims increased to 965,000
by Calculated Risk on 1/14/2021 08:38:00 AM
The DOL reported:
In the week ending January 9, the advance figure for seasonally adjusted initial claims was 965,000, an increase of 181,000 from the previous week's revised level. The previous week's level was revised down by 3,000 from 787,000 to 784,000. The 4-week moving average was 834,250, an increase of 18,250 from the previous week's revised average. The previous week's average was revised down by 2,750 from 818,750 to 816,000.This does not include the 284,470 initial claims for Pandemic Unemployment Assistance (PUA) that was up from 161,159 the previous week.
emphasis added
The following graph shows the 4-week moving average of weekly claims since 1971.
 Click on graph for larger image.
The dashed line on the graph is the current 4-week average. The four-week average of weekly unemployment claims increased to 834,250.
The previous week was revised down.
The second graph shows seasonally adjust continued claims since 1967 (lags initial by one week).
 At the worst of the Great Recession, continued claims peaked at 6.635 million, but then steadily declined.
Regular state continued claims increased to 5,271,000 (SA) from 5,072,000 (SA) the previous week and will likely stay at a high level until the crisis abates.
Note: There are an additional 7,442,888 receiving Pandemic Unemployment Assistance (PUA) that decreased from 8,383,387 the previous week (there are questions about these numbers). This is a special program for business owners, self-employed, independent contractors or gig workers not receiving other unemployment insurance.
An additional 4,166,261 are receiving Pandemic Emergency Unemployment Compensation (PEUC) that decreased from 4,491,413 the previous week.
Wednesday, January 13, 2021
Thursday: Unemployment Claims, Fed Chair Powell
by Calculated Risk on 1/13/2021 09:49:00 PM
Thursday:
• At 8:30 AM ET, The initial weekly unemployment claims report will be released. The consensus is for an increase to 850 thousand from 787 thousand last week.
• At 12:30 PM, Discussion, Fed Chair Jerome Powell, "A Conversation with Federal Reserve Chair Jerome Powell", At a livestream event hosted by Markus Brunnermerier, Director, Princeton University Bendheim Center for Finance
January 13 COVID-19 Test Results; Record 7-Day Deaths
by Calculated Risk on 1/13/2021 07:19:00 PM
Note: It is possible the 7-day average cases is nearing a peak. I'm looking forward to not posting this data in a few months.
The US is now averaging close to 2 million tests per day. Based on the experience of other countries, for adequate test-and-trace (and isolation) to reduce infections, the percent positive needs to be under 5% (probably close to 1%), so the US has far too many daily cases - and percent positive - to do effective test-and-trace.
There were 1,793,568 test results reported over the last 24 hours.
There were 219,090 positive tests.
Almost 39,000 US deaths have been reported so far in January. See the graph on US Daily Deaths here.
 Click on graph for larger image.
This data is from the COVID Tracking Project.
The percent positive over the last 24 hours was 12.2% (red line is 7 day average). The percent positive is calculated by dividing positive results by total tests (including pending).
And check out COVID Act Now to see how each state is doing. (updated link to new site)
 The second graph shows the 7 day average of positive tests reported and daily hospitalizations.
• Record 7-Day Deaths
Las Vegas Visitor Authority: No Convention Attendance, Visitor Traffic Down 57% YoY in November
by Calculated Risk on 1/13/2021 04:57:00 PM
From the Las Vegas Visitor Authority: November 2020 Las Vegas Visitor Statistics
With increasing COVID cases across the country and resumption of tighter travel restrictions and stay‐at‐ home orders in the latter half of November, Las Vegas visitation came in at approximately 1.5M, down ‐18.4% MoM and ‐56.8% YoY.Here is the data from the Las Vegas Convention and Visitors Authority.
Total occupancy reached 39.3% for the month with weekend occupancy coming in at 55.4% and midweek occupancy at 32.4%.
Average daily rates among open properties reached $94 (‐10.1% MoM, ‐30.3% YoY) while RevPAR came in at approx. $37, down ‐69% vs. Nov 2019.
 Click on graph for larger image.
 The blue and red bars are monthly visitor traffic (left scale) for 2019 and 2020. The dashed blue and orange lines are convention attendance (right scale).
Convention traffic in November was down 100% compared to October 2019.
And visitor traffic was down 57% YoY.
The casinos started to reopen on June 4th (it appears about 95% of rooms have now opened).
Houston Real Estate in December: Sales Up 27% YoY, Inventory Down 29% YoY
by Calculated Risk on 1/13/2021 12:19:00 PM
From the HAR: The Houston Housing Market Defies a Pandemic to Set New Records in 2020
Not even a devastating global pandemic could stop the Houston real estate market from shattering records as it crossed the finish line for the 2020 calendar year. Single-family home sales surpassed 2019’s record volume by more than 10 percent, even as the supply of homes withered to the lowest levels of all time.Inventory declined 28.6% year-over-year from 37,574 in December 2019 to 26,821 in December 2020. This is just 1.9 months of supply.
...
According to HAR’s 2020 annual market report, single-family home sales rose 10.5 percent to 96,151. Sales of all property types for the year totaled 115,523. That represents an 11.6-percent increase over 2019’s record volume and marks only the second time in history that total property sales broke the 100,000 level. Total dollar volume for 2020 shot up 18.1 percent to a record-breaking $35.3 billion.
...
December single-family home sales jumped 25.5 percent year-over-year with 9,652 units sold; Total December property sales increased 27.2 percent to 11,572 units;
...
Total active listings, or the total number of available properties, fell 28.6 percent from a year earlier to 26,821.
emphasis added
Note that the closed sales in December were for contracts that were mostly signed in October and November.
Cleveland Fed: Key Measures Show Inflation Soft in December
by Calculated Risk on 1/13/2021 11:11:00 AM
The Cleveland Fed released the median CPI and the trimmed-mean CPI this morning:
According to the Federal Reserve Bank of Cleveland, the median Consumer Price Index rose 0.1% December. The 16% trimmed-mean Consumer Price Index rose 0.2% in December. "The median CPI and 16% trimmed-mean CPI are measures of core inflation calculated by the Federal Reserve Bank of Cleveland based on data released in the Bureau of Labor Statistics’ (BLS) monthly CPI report".
Note: The Cleveland Fed released the median CPI details for December here. Motor fuel was up 161% annualized in December.
 Click on graph for larger image.
This graph shows the year-over-year change for these four key measures of inflation. On a year-over-year basis, the median CPI rose 2.2%, the trimmed-mean CPI rose 2.1%, and the CPI less food and energy rose 1.6%. Core PCE is for November and increased 1.4% year-over-year.
Overall inflation will not be a concern during the crisis.
Important Note: We will likely see some year-over-year jumps in some measures of inflation, since we saw some deflation in 2020. For example, we saw negative Month-to-month (MoM) core CPI and CPI readings in March, April and May 2020. Assuming positive readings in those months in 2021, the YoY change in CPI and core CPI will jump.
We also saw negative MoM PCE and core PCE reading in March and April 2020. Ignore a jump in YoY inflation in March, April and May!
BLS: CPI increased 0.4% in December, Core CPI Increased 0.1%
by Calculated Risk on 1/13/2021 08:32:00 AM
The Consumer Price Index for All Urban Consumers (CPI-U) increased 0.4 percent in December on a seasonally adjusted basis after rising 0.2 percent in November, the U.S. Bureau of Labor Statistics reported today. Over the last 12 months, the all items index increased 1.4 percent before seasonal adjustment.Inflation was at expectations in December. I'll post a graph later today after the Cleveland Fed releases the median and trimmed-mean CPI.
The seasonally adjusted increase in the all items index was driven by an 8.4-percent increase in the gasoline index, which accounted for more than 60 percent of the overall increase. The other components of the energy index were mixed, resulting in an increase of 4.0 percent for the month. The food index rose in December, as both the food at home and the food away from home indexes increased 0.4 percent.
The index for all items less food and energy increased 0.1 percent in December after rising 0.2 percent in the previous month. The indexes for apparel, motor vehicle insurance, new vehicles, personal care, and household furnishings and operations all rose in December. The indexes for used cars and trucks, recreation, and medical care were among those to decline over the month.
The all items index rose 1.4 percent for the 12 months ending December, a slightly larger increase than the 1.2-percent rise reported for the period ending November. The index for all items less food and energy rose 1.6 percent over the last 12 months, as it did in the periods ending October and November.
emphasis added


