 RSS Feed
 by Calculated Risk on 1/13/2021 04:57:00 PM
Wednesday, January 13, 2021
Las Vegas Visitor Authority: No Convention Attendance, Visitor Traffic Down 57% YoY in November
From the Las Vegas Visitor Authority: November 2020 Las Vegas Visitor Statistics
With increasing COVID cases across the country and resumption of tighter travel restrictions and stay‐at‐ home orders in the latter half of November, Las Vegas visitation came in at approximately 1.5M, down ‐18.4% MoM and ‐56.8% YoY.Here is the data from the Las Vegas Convention and Visitors Authority.
Total occupancy reached 39.3% for the month with weekend occupancy coming in at 55.4% and midweek occupancy at 32.4%.
Average daily rates among open properties reached $94 (‐10.1% MoM, ‐30.3% YoY) while RevPAR came in at approx. $37, down ‐69% vs. Nov 2019.
 Click on graph for larger image.
 The blue and red bars are monthly visitor traffic (left scale) for 2019 and 2020. The dashed blue and orange lines are convention attendance (right scale).
Convention traffic in November was down 100% compared to October 2019.
And visitor traffic was down 57% YoY.
The casinos started to reopen on June 4th (it appears about 95% of rooms have now opened).
Houston Real Estate in December: Sales Up 27% YoY, Inventory Down 29% YoY
by Calculated Risk on 1/13/2021 12:19:00 PM
From the HAR: The Houston Housing Market Defies a Pandemic to Set New Records in 2020
Not even a devastating global pandemic could stop the Houston real estate market from shattering records as it crossed the finish line for the 2020 calendar year. Single-family home sales surpassed 2019’s record volume by more than 10 percent, even as the supply of homes withered to the lowest levels of all time.Inventory declined 28.6% year-over-year from 37,574 in December 2019 to 26,821 in December 2020. This is just 1.9 months of supply.
...
According to HAR’s 2020 annual market report, single-family home sales rose 10.5 percent to 96,151. Sales of all property types for the year totaled 115,523. That represents an 11.6-percent increase over 2019’s record volume and marks only the second time in history that total property sales broke the 100,000 level. Total dollar volume for 2020 shot up 18.1 percent to a record-breaking $35.3 billion.
...
December single-family home sales jumped 25.5 percent year-over-year with 9,652 units sold; Total December property sales increased 27.2 percent to 11,572 units;
...
Total active listings, or the total number of available properties, fell 28.6 percent from a year earlier to 26,821.
emphasis added
Note that the closed sales in December were for contracts that were mostly signed in October and November.
Cleveland Fed: Key Measures Show Inflation Soft in December
by Calculated Risk on 1/13/2021 11:11:00 AM
The Cleveland Fed released the median CPI and the trimmed-mean CPI this morning:
According to the Federal Reserve Bank of Cleveland, the median Consumer Price Index rose 0.1% December. The 16% trimmed-mean Consumer Price Index rose 0.2% in December. "The median CPI and 16% trimmed-mean CPI are measures of core inflation calculated by the Federal Reserve Bank of Cleveland based on data released in the Bureau of Labor Statistics’ (BLS) monthly CPI report".
Note: The Cleveland Fed released the median CPI details for December here. Motor fuel was up 161% annualized in December.
 Click on graph for larger image.
This graph shows the year-over-year change for these four key measures of inflation. On a year-over-year basis, the median CPI rose 2.2%, the trimmed-mean CPI rose 2.1%, and the CPI less food and energy rose 1.6%. Core PCE is for November and increased 1.4% year-over-year.
Overall inflation will not be a concern during the crisis.
Important Note: We will likely see some year-over-year jumps in some measures of inflation, since we saw some deflation in 2020. For example, we saw negative Month-to-month (MoM) core CPI and CPI readings in March, April and May 2020. Assuming positive readings in those months in 2021, the YoY change in CPI and core CPI will jump.
We also saw negative MoM PCE and core PCE reading in March and April 2020. Ignore a jump in YoY inflation in March, April and May!
BLS: CPI increased 0.4% in December, Core CPI Increased 0.1%
by Calculated Risk on 1/13/2021 08:32:00 AM
The Consumer Price Index for All Urban Consumers (CPI-U) increased 0.4 percent in December on a seasonally adjusted basis after rising 0.2 percent in November, the U.S. Bureau of Labor Statistics reported today. Over the last 12 months, the all items index increased 1.4 percent before seasonal adjustment.Inflation was at expectations in December. I'll post a graph later today after the Cleveland Fed releases the median and trimmed-mean CPI.
The seasonally adjusted increase in the all items index was driven by an 8.4-percent increase in the gasoline index, which accounted for more than 60 percent of the overall increase. The other components of the energy index were mixed, resulting in an increase of 4.0 percent for the month. The food index rose in December, as both the food at home and the food away from home indexes increased 0.4 percent.
The index for all items less food and energy increased 0.1 percent in December after rising 0.2 percent in the previous month. The indexes for apparel, motor vehicle insurance, new vehicles, personal care, and household furnishings and operations all rose in December. The indexes for used cars and trucks, recreation, and medical care were among those to decline over the month.
The all items index rose 1.4 percent for the 12 months ending December, a slightly larger increase than the 1.2-percent rise reported for the period ending November. The index for all items less food and energy rose 1.6 percent over the last 12 months, as it did in the periods ending October and November.
emphasis added
MBA: Mortgage Applications Increase in Latest Weekly Survey
by Calculated Risk on 1/13/2021 07:00:00 AM
From the MBA: Mortgage Applications Increase in Latest MBA Weekly Survey
Mortgage applications increased 16.7 percent from one week earlier, according to data from the Mortgage Bankers Association’s (MBA) Weekly Mortgage Applications Survey for the week ending January 8, 2021. The previous week’s results included an adjustment for the holidays.
... The Refinance Index increased 20 percent from the previous week and was 93 percent higher than the same week one year ago. The seasonally adjusted Purchase Index increased 8 percent from one week earlier. The unadjusted Purchase Index increased 60 percent compared with the previous week and was 10 percent higher than the same week one year ago.
“Booming refinance activity in the first full week of 2021 caused mortgage applications to surge to their highest level since March 2020, despite most mortgage rates in the survey rising last week. The expectation of additional fiscal stimulus from the incoming administration, and the rollout of vaccines improving the outlook, drove Treasury yields and rates higher. The 30-year fixed mortgage rate climbed two basis points to 2.88 percent, but reversing the trend, the 15-year fixed rate ticked down to 2.39 percent – a record low,” said Joel Kan, MBA’s Associate Vice President of Economic and Industry Forecasting. “Even with the rise in mortgage rates, refinancing did not slow to begin the year, with the index hitting its highest level since last March. Both conventional and government refinance applications increased, with applications for government loans having their strongest week since June 2012.”
Added Kan, “Sustained housing demand continued to support purchase growth, with activity up nearly 10 percent from a year ago. The lower average loan balance observed was partly due to a 9.2 percent increase in FHA applications, which is a positive sign of more lower-income and first-time buyers returning to the market.”
...
The average contract interest rate for 30-year fixed-rate mortgages with conforming loan balances ($510,400 or less) increased to 2.88 percent from 2.86 percent, with points decreasing to 0.33 from 0.35 (including the origination fee) for 80 percent loan-to-value ratio (LTV) loans.
emphasis added
 Click on graph for larger image.
The first graph shows the refinance index since 1990.
The refinance index has been very volatile recently depending on rates and liquidity.
But with record low rates, the index remains up significantly from last year.
 The second graph shows the MBA mortgage purchase index
According to the MBA, purchase activity is up 10% year-over-year unadjusted.
Note: Red is a four-week average (blue is weekly).
Tuesday, January 12, 2021
Wednesday: CPI, Beige Book
by Calculated Risk on 1/12/2021 09:26:00 PM
Wednesday:
• At 7:00 AM ET, The Mortgage Bankers Association (MBA) will release the results for the mortgage purchase applications index.
• At 8:30 AM, The Consumer Price Index for December from the BLS. The consensus is for 0.4% increase in CPI, and a 0.1% increase in core CPI.
• At 2:00 PM, the Federal Reserve Beige Book, an informal review by the Federal Reserve Banks of current economic conditions in their Districts.
January 12 COVID-19 Test Results; Record 7-Day Deaths
by Calculated Risk on 1/12/2021 07:32:00 PM
Note: It is possible the 7-day average cases is nearing a peak. I'm looking forward to not posting this data in a few months.
The US is now averaging close to 2 million tests per day. Based on the experience of other countries, for adequate test-and-trace (and isolation) to reduce infections, the percent positive needs to be under 5% (probably close to 1%), so the US has far too many daily cases - and percent positive - to do effective test-and-trace.
There were 1,871,244 test results reported over the last 24 hours.
There were 213,885 positive tests.
Almost 35,000 US deaths have been reported so far in January. See the graph on US Daily Deaths here.
 Click on graph for larger image.
This data is from the COVID Tracking Project.
The percent positive over the last 24 hours was 11.4% (red line is 7 day average). The percent positive is calculated by dividing positive results by total tests (including pending).
And check out COVID Act Now to see how each state is doing. (updated link to new site)
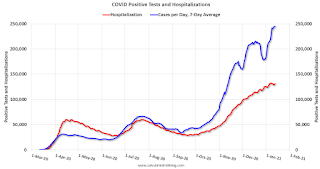 The second graph shows the 7 day average of positive tests reported and daily hospitalizations.
• Record 7-Day Deaths
Denver Real Estate in December: Sales Up 5% YoY, Active Inventory Down 50%
by Calculated Risk on 1/12/2021 01:29:00 PM
From the DMAR: Monthly Indicators, December 2020
The number of residential units sold in December (attached and detached) increased to 4,807, up 4.9% from 4,582 in December 2019.
Active listings were at 2,541, down 49.6% from 5,037 in December 2019. This is a record low.
Annual sales were up 7.0% compared to 2019.
BLS: Job Openings "Little Changed" at 6.5 Million in November
by Calculated Risk on 1/12/2021 10:06:00 AM
From the BLS: Job Openings and Labor Turnover Summary
The number of job openings was little changed at 6.5 million on the last business day of November, the U.S. Bureau of Labor Statistics reported today. Hires were little changed at 6.0 million while total separations increased to 5.4 million. Within separations, the quits rate was unchanged at 2.2 percent while the layoffs and discharges rate increased to 1.4 percent.The following graph shows job openings (yellow line), hires (dark blue), Layoff, Discharges and other (red column), and Quits (light blue column) from the JOLTS.
emphasis added
This series started in December 2000.
Note: The difference between JOLTS hires and separations is similar to the CES (payroll survey) net jobs headline numbers. This report is for November, the most recent employment report was for December.
 Click on graph for larger image.
Note that hires (dark blue) and total separations (red and light blue columns stacked) are usually pretty close each month. This is a measure of labor market turnover. When the blue line is above the two stacked columns, the economy is adding net jobs - when it is below the columns, the economy is losing jobs.
The huge spikes in layoffs and discharges in March and April 2020 are labeled, but off the chart to better show the usual data.
Jobs openings decreased in November to 6.527 million from 6.632 million in October.
The number of job openings (yellow) were down 3.9% year-over-year. Note that job openings were declining a year ago prior to the pandemic.
Quits were down 10.5% year-over-year. These are voluntary separations. (see light blue columns at bottom of graph for trend for "quits").
Small Business Optimism Decreased in December
by Calculated Risk on 1/12/2021 08:34:00 AM
Most of this survey is noise, but sometimes there is some information.
From the National Federation of Independent Business (NFIB): December 2020 Report
The Optimism Index declined to 95.9 in December, down 5.5. points from November. Nine of the 10 Index components declined and one improved. The NFIB Uncertainty Index decreased 8 points to 82. Owners expecting better business conditions over the next six months declined 24 points to a net negative 16 percent. The percent of owners thinking it’s a good time to expand decreased 4 points to 8 percent. Sales expectations over the next three months declined 14 points to a net negative 4 percent.
.
Covid-19 is spreading at record rates and hospitals are at capacity in many states. Several vaccines were proven effective in trials, approved for emergency use, and now being distributed. But business restrictions and consumer spending shifts are still firmly in place and will be until the spread of Covid-19 is largely curbed.
emphasis added
 Click on graph for larger image.
This graph shows the small business optimism index since 1986.
The index declined in December.


