by Calculated Risk on 9/19/2020 06:35:00 PM
Saturday, September 19, 2020
September 19 COVID-19 Test Results
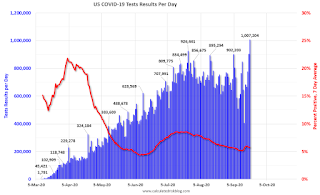
The US is now mostly reporting over 700,000 tests per day. Based on the experience of other countries, the percent positive needs to be well under 5% to really push down new infections, so the US still needs to increase the number of tests per day significantly (or take actions to push down the number of new infections).
There were 1,007,204 test results reported over the last 24 hours. A new record.
There were 46,609 positive tests.
Close to 16,000 Americans have died from COVID so far in September. See the graph on US Daily Deaths here.

This data is from the COVID Tracking Project.
The percent positive over the last 24 hours was 4.6% (red line is 7 day average).
For the status of contact tracing by state, check out testandtrace.com.
And check out COVID Exit Strategy to see how each state is doing.

The dashed line is the June low.
Note that there were very few tests available in March and April, and many cases were missed (the percent positive was very high - see first graph). By June, the percent positive had dropped below 5%.
If people stay vigilant, the number of cases might drop to the June low some time in October (that would still be a large number of new cases, but progress).
Schedule for Week of September 20, 2020
by Calculated Risk on 9/19/2020 08:11:00 AM
The key reports this week are August New and Existing Home sales.
For manufacturing, the Richmond and Kansas City Fed manufacturing surveys will be released this week.
Fed Chair Powell testifies three times this week.
8:30 AM ET: Chicago Fed National Activity Index for August. This is a composite index of other data.
12:00 PM: Q2 Flow of Funds Accounts of the United States from the Federal Reserve.
 10:00 AM: Existing Home Sales for August from the National Association of Realtors (NAR). The consensus is for 6.00 million SAAR, up from 5.86 million in July.
The graph shows existing home sales from 1994 through the report last month.
Housing economist Tom Lawler expects the NAR to report 5.92 million SAAR.
10:00 AM: Richmond Fed Survey of Manufacturing Activity for September.
10:30 AM: Testimony, Fed Chair Jerome Powell, Coronavirus Aid, Relief, and Economic Security Act, Before the Committee on Financial Services, U.S. House of Representatives
7:00 AM ET: The Mortgage Bankers Association (MBA) will release the results for the mortgage purchase applications index.
9:00 AM: FHFA House Price Index for July. This was originally a GSE only repeat sales, however there is also an expanded index.
10:00 AM: Testimony, Fed Chair Jerome Powell, Coronavirus Response, Before the Select Subcommittee on Coronavirus Crisis, U.S. House of Representatives
During the day: The AIA's Architecture Billings Index for August (a leading indicator for commercial real estate).
8:30 AM: The initial weekly unemployment claims report will be released. Initial claims were 860 thousand the previous week.
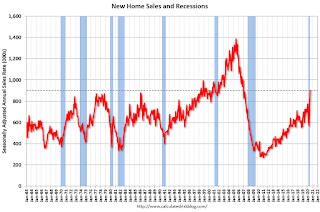
 10:00 AM: New Home Sales for August from the Census Bureau.
 This graph shows New Home Sales since 1963. The dashed line is the sales rate for last month.
The consensus is for 900 thousand SAAR, essentially unchanged from 901 thousand in July.
10:00 AM: Testimony, Fed Chair Jerome Powell, Coronavirus Aid, Relief, and Economic Security Act, Before the Committee on Banking, Housing, and Urban Affairs, U.S. Senate
11:00 AM: the Kansas City Fed manufacturing survey for September.
8:30 AM: Durable Goods Orders for August from the Census Bureau. The consensus is for a 1.5% decrease in durable goods orders.
Friday, September 18, 2020
September 18 COVID-19 Test Results
by Calculated Risk on 9/18/2020 06:44:00 PM
The US is now mostly reporting over 700,000 tests per day. Based on the experience of other countries, the percent positive needs to be well under 5% to really push down new infections, so the US still needs to increase the number of tests per day significantly (or take actions to push down the number of new infections).
There were 903,627 test results reported over the last 24 hours.
There were 47,486 positive tests.
Almost 15,000 Americans have died from COVID so far in September. See the graph on US Daily Deaths here.

This data is from the COVID Tracking Project.
The percent positive over the last 24 hours was 5.3% (red line is 7 day average).
For the status of contact tracing by state, check out testandtrace.com.
And check out COVID Exit Strategy to see how each state is doing.

The dashed line is the June low.
Note that there were very few tests available in March and April, and many cases were missed (the percent positive was very high - see first graph). By June, the percent positive had dropped below 5%.
If people stay vigilant, the number of cases might drop to the June low some time in October (that would still be a large number of new cases, but progress).
Lawler: Early Read on Existing Home Sales in August
by Calculated Risk on 9/18/2020 02:42:00 PM
From housing economist Tom Lawler:
Based on publicly-available local realtor/MLS reports released across the country through today, I project that existing home sales as estimated by the National Association of Realtors ran at a seasonally adjusted annual rate of 5.92 million in August, up 1.0% from July’s preliminary pace and up 9.0% from last August’s seasonally adjusted pace. Unadjusted sales should show a smaller YOY increase, reflecting this August’s lower business day count relative to last August’s.
Local realtor/MLS data suggest that the median US existing single-family home sales price last month was up by a steamy 11.6% from last August, partly boosted by the mix of home sales but mainly boosted by the lack of available inventory across much of the country combined with strong demand for SF detached homes.
While not all realtor reports include data on new pending sales – and some that do often revise those data significantly – the limited data available suggest that the YOY increase in pending sales again exceeded the YOY gain in closed sales last month.
Projecting the NAR’s inventory estimate for August is tricky. Local realtor/MLS reports suggest that the “inventory” of homes for sale last month was down by about 35% nationwide in August. However, those same local reports for July would have suggested a much sharply YOY drop in inventories than the NAR reported.
Most of these local realtor/MLS reports utilize third-party software, and most exclude all pending contracts from their inventory number. These reports differ from the reports sent to the NAR, and it is my understanding is that most local realtors/MLS include pending listings in the inventory number in their NAR report.
...
Given both the sales and inventory numbers, it’s perhaps not shocking that there has been a rapid acceleration in home prices over the past few months – to the point that one can at least say the single-family housing market has become “frothy,” and perhaps even become a little “bubbly.”
If in fact the recent surge in median sales prices reflects a jump in overall prices (rather than a shift in the mix in sales), it will not show up in some widely followed “repeat-transactions) home price indexes for a few months.
CR Note: The National Association of Realtors (NAR) is scheduled to release August existing home sales on Tuesday, September 22, 2020 at 10:00 AM ET. The consensus is for 6.00 million SAAR.
Q3 GDP Forecasts
by Calculated Risk on 9/18/2020 11:39:00 AM
From the NY Fed Nowcasting Report
The New York Fed Staff Nowcast stands at 14.3% for 2020:Q3 and 5.3% for 2020:Q4. [Sept 18 estimate]And from the Altanta Fed: GDPNow
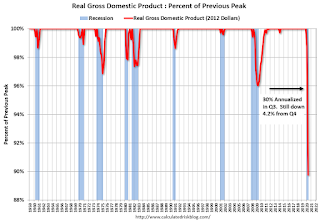
The GDPNow model estimate for real GDP growth (seasonally adjusted annual rate) in the third quarter of 2020 is 32.0 percent on September 17, up from 31.7 percent on September 16. [Sept 17 estimate]It is important to note that GDP is reported at a seasonally adjusted annual rate (SAAR). A 30% annualized increase in Q3 GDP, is about 6.8% QoQ, and would leave real GDP down about 4.2% from Q4 2019.
The following graph illustrates this decline.
 Click on graph for larger image.
This graph shows the percent decline in real GDP from the previous peak (currently the previous peak was in Q4 2019).
This graph is through Q2 2020, and real GDP is currently off 10.2% from the previous peak. For comparison, at the depth of the Great Recession, real GDP was down 4.0% from the previous peak.
The black arrow shows what a 30% annualized increase in real GDP would look like in Q3.
Even with a 30% annualized increase (about 6.8% QoQ), real GDP will be down about 4.2% from Q4 2019; a larger decline in real GDP than at the depth of the Great Recession.
BLS: August Unemployment rates down in 41 states
by Calculated Risk on 9/18/2020 10:14:00 AM
From the BLS: Regional and State Employment and Unemployment Summary
Unemployment rates were lower in August in 41 states, higher in 2 states, and stable in 7 states and the District of Columbia, the U.S. Bureau of Labor Statistics reported today. All 50 states and the District had jobless rate increases from a year earlier. The national unemployment rate fell by 1.8 percentage points over the month to 8.4 percent but was 4.7 points higher than in August 2019.
...
Nevada had the highest unemployment rate in August, 13.2 percent, followed by Rhode Island, 12.8 percent, and Hawaii and New York, 12.5 percent each. Nebraska had the lowest rate, 4.0 percent, followed by Utah, 4.1 percent, and Idaho, 4.2 percent.
Black Knight: Number of Homeowners in COVID-19-Related Forbearance Plans Decreased
by Calculated Risk on 9/18/2020 08:28:00 AM
Note: Both Black Knight and the MBA (Mortgage Bankers Association) are putting out weekly estimates of mortgages in forbearance.
This data is as of September 15th.
From Fourth Consecutive Week of Forbearance Improvement
Overall, the total number of mortgages in forbearance continued to improve this week, as the number of active plans declined another 26K (-0.7%). This marks the fourth consecutive week of improvement, and declining volumes for 10 of the past 12 weeks.
Click on graph for larger image.
As of September 15, just under 3.7M homeowners remain in COVID-19-related forbearance plans. That’s down more than 22% from the peak of over 4.7M in late May.
These loans represent 7% of the active mortgage universe, unchanged from last week. Together, they represent $781 billion in unpaid principal.
Active forbearances are now down 266K (-7%) over the past 30 days, as servicers continue to proactively assess the 1.7M forbearance plans still set to expire in September for extensions and removals.
Given the large number of plans in which September’s mortgage payment was the last payment covered under forbearance plan, we could see significant removal/extension activity over the next few weeks.
emphasis added
Thursday, September 17, 2020
September 17 COVID-19 Test Results
by Calculated Risk on 9/17/2020 06:44:00 PM
The US is now mostly reporting over 700,000 tests per day. Based on the experience of other countries, the percent positive needs to be well under 5% to really push down new infections, so the US still needs to increase the number of tests per day significantly (or take actions to push down the number of new infections).
There were 776,769 test results reported over the last 24 hours.
There were 43,558 positive tests.
Over 14,000 Americans have died from COVID so far in September. See the graph on US Daily Deaths here.

This data is from the COVID Tracking Project.
The percent positive over the last 24 hours was 5.9% (red line). NOTE: The percent positive is a seven day average on the graph.
For the status of contact tracing by state, check out testandtrace.com.
And check out COVID Exit Strategy to see how each state is doing.

The dashed line is the June low.
Note that there were very few tests available in March and April, and many cases were missed (the percent positive was very high - see first graph). By June, the percent positive had dropped below 5%.
If people stay vigilant, the number of cases might drop to the June low by the end of September - although this seems unlikely now (that would still be a large number of new cases, but progress).
Philly Fed Manufacturing "continued to expand" in September
by Calculated Risk on 9/17/2020 02:54:00 PM
Note: Be careful with diffusion indexes. This shows a rebound off the bottom - some improvement from May to September - but doesn't show the level of activity.
Earlier from the Philly Fed: September 2020 Manufacturing Business Outlook Survey
Manufacturing activity in the region continued to expand this month, according to firms responding to the September Manufacturing Business Outlook Survey. The survey’s current indicators for general activity, new orders, and shipments remained positive for the fourth consecutive month. The employment index improved in September and remained in positive territory for the third consecutive month. Nearly all of the future indexes increased, suggesting more widespread optimism among firms about growth over the next six months.This was close to the consensus forecast. Here is a graph comparing the regional Fed surveys and the ISM manufacturing index:
The diffusion index for current activity fell 2 points to 15.0 in September, its fourth consecutive positive reading after reaching long-term lows in April and May… On balance, the firms reported increases in manufacturing employment for the third consecutive month: The current employment index increased 7 points to 15.7 this month.
emphasis added
 Click on graph for larger image.
The New York and Philly Fed surveys are averaged together (blue, through September), and five Fed surveys are averaged (yellow, through August) including New York, Philly, Richmond, Dallas and Kansas City. The Institute for Supply Management (ISM) PMI (red) is through August (right axis).
These early reports suggest the ISM manufacturing index will likely not change much from the August level.
CAR on California August Housing: Sales up 15% YoY, Active Listings down 50% YoY, Sales-to-date Down 7% Compared to 2019
by Calculated Risk on 9/17/2020 12:21:00 PM
The CAR reported: California housing market continues recovery as median home price breaks $700,000 mark, C.A.R. reports
California’s housing market continued to improve in August as home sales climbed to their highest level in more than a decade as the median home price broke last month’s record and hit another high, the CALIFORNIA ASSOCIATION OF REALTORS® (C.A.R.) said today.CR Note: Existing home sales are reported when the transaction closes, so this was mostly for contracts signed in June and July. Sales-to-date, through August, are down 6.8% compared to the same period in 2019.
Closed escrow sales of existing, single-family detached homes in California totaled a seasonally adjusted annualized rate of 465,400 units in August, according to information collected by C.A.R. from more than 90 local REALTOR® associations and MLSs statewide. The statewide annualized sales figure represents what would be the total number of homes sold during 2020 if sales maintained the August pace throughout the year. It is adjusted to account for seasonal factors that typically influence home sales.
August’s sales total climbed above the 400,000 level for the second straight month since the COVID-19 crisis depressed the housing market earlier this year, marking the first time since the summer of 2016 that sales increased from the previous month three months in a row. August sales rose 6.3 percent from 437,890 in July and were up 14.6 percent from a year ago, when 406,100 homes were sold on an annualized basis.
...
With fewer for-sale properties being added to the market, housing supply remained significantly below last year’s level. The 50.3 percent drop from a year ago was the biggest decline in active listings since at least January 2008. It was also the ninth consecutive month with active listings falling more than 25 percent from the prior year.
emphasis added


