by Calculated Risk on 8/08/2020 05:53:00 PM
Saturday, August 08, 2020
August 8 COVID-19 Test Results
Note: There are some states having reporting problems.
The US is now mostly reporting over 700,000 tests per day. Based on the experience of other countries, the percent positive needs to be well under 5% to really push down new infections, so the US still needs to increase the number of tests per day significantly (or take actions to push down the number of new infections).
There were 665,029 test results reported over the last 24 hours.
There were 53,923 positive tests.
See the graph on US Daily Deaths here.

This data is from the COVID Tracking Project.
The percent positive over the last 24 hours was 8.1% (red line).
For the status of contact tracing by state, check out testandtrace.com.
And check out COVID Exit Strategy to see how each state is doing.
State and Local Education Employment in August
by Calculated Risk on 8/08/2020 01:39:00 PM
There is a seasonal pattern to state and local education employment. A large number of educators are hired in late Summer or early Fall - at the beginning of the school year - and then let go in June and July. Due to the pandemic, many of these educators were let go earlier than usual this year.
This led to a weird quirk in the seasonal adjustment for July. Although there were 960,000 state and local education jobs lost in July NSA (Not Seasonally Adjusted), this was reported as a gain of 245,000 jobs (SA). This was fewer jobs added (SA) than I expected, but it was difficult to tell how many year-round jobs had been lost. Now we know.
The following table shows the number of year-round and seasonal state and local education jobs for February and July.
| State and Local Education Employment NSA (000s) | |||||
|---|---|---|---|---|---|
| Month | Year Round | Seasonal | Total | Net Jobs NSA | Net Jobs SA |
| Feb-20 | 8,979 | 2,000 | 10,979 | ||
| Jul-20 | 8,344 | 0 | 8,344 | -2,635 | -635 |
All of the seasonal jobs have been let go (my estimate is around 2 million), and about 635,000 year-round jobs have been lost.
Usually we'd expect about 415,000 seasonal jobs hired in August. However, since many school districts are delaying the opening of the school year, my guess is few of these seasonal jobs will be filled in August.
Also, since the BLS reference week for August starts tomorrow (August 9th to the 15th), it is unlikely that any disaster relief for state and local governments will be available this week.
The BLS model will expect about 415,000 seasonal jobs added in August. If only a few jobs are added, the model could report 400,000+ jobs lost in August (SA). In addition, state and local governments may need to make further cuts to year-round employment in August.
So my initial guess is the BLS will report 400,000 to 500,000 state and local education jobs lost in August (SA).
Schedule for Week of August 9, 2020
by Calculated Risk on 8/08/2020 08:11:00 AM
The key reports this week are July CPI and Retail sales.
For manufacturing, the Industrial Production report will be released.
 10:00 AM ET: Job Openings and Labor Turnover Survey for June from the BLS.
 This graph shows job openings (yellow line), hires (purple), Layoff, Discharges and other (red column), and Quits (light blue column) from the JOLTS.
Jobs openings increased in May to 5.397 million from 4.996 million in April.
The number of job openings (yellow) were down 26% year-over-year, and Quits were down 41% year-over-year.
6:00 AM ET: NFIB Small Business Optimism Index for July.
8:30 AM: The Producer Price Index for July from the BLS. The consensus is for a 0.3% increase in PPI, and a 0.1% increase in core PPI.
12:00 PM: MBA Q2 National Delinquency Survey
7:00 AM ET: The Mortgage Bankers Association (MBA) will release the results for the mortgage purchase applications index.
8:30 AM: The Consumer Price Index for July from the BLS. The consensus is for a 0.3% increase in CPI, and a 0.2% increase in core CPI.
8:30 AM: The initial weekly unemployment claims report will be released. The early consensus is for a 1.100 million initial claims, down from 1.186 million the previous week.
 8:30 AM: Retail sales for July is scheduled to be released. The consensus is for 1.8% increase in retail sales.
This graph shows the year-over-year change in retail sales and food service (ex-gasoline) since 1993. Retail and Food service sales, ex-gasoline, increased by 2.7% on a YoY basis.
 9:15 AM: The Fed will release Industrial Production and Capacity Utilization for July.
This graph shows industrial production since 1967.
The consensus is for a 3.0% increase in Industrial Production, and for Capacity Utilization to increase to 70.2%.
10:00 AM: University of Michigan's Consumer sentiment index (Preliminary for August).
Friday, August 07, 2020
August 7 COVID-19 Test Results
by Calculated Risk on 8/07/2020 06:28:00 PM
Note: There are some states having reporting problems.
Stunning death numbers from the NY Times (and the CDC): Tracking the Real Coronavirus Death Toll in the United States
Nationwide, 200,700 more people have died than usual from March 15 to July 25, according to C.D.C. estimates, which adjust current death records to account for typical reporting lags. That number is 54,000 higher than the official count of coronavirus deaths for that period.The US is now mostly reporting over 700,000 tests per day. Based on the experience of other countries, the percent positive needs to be well under 5% to really push down new infections, so the US still needs to increase the number of tests per day significantly (or take actions to push down the number of new infections).
...
Many epidemiologists believe measuring excess deaths is the best way to assess the impact of the virus in real time. It shows how the virus is altering normal patterns of mortality. The high numbers from the coronavirus pandemic period undermine arguments that the virus is merely killing vulnerable people who would have died anyway.
There were 762,883 test results reported over the last 24 hours.
There were 61,520 positive tests.
See the graph on US Daily Deaths here.
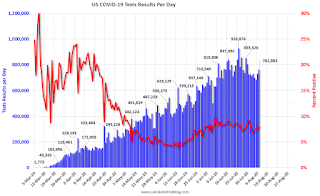 Click on graph for larger image.
This data is from the COVID Tracking Project.
The percent positive over the last 24 hours was 8.1% (red line).
For the status of contact tracing by state, check out testandtrace.com.
And check out COVID Exit Strategy to see how each state is doing.
AAR: July Rail Carloads down 17.6% YoY, Intermodal Down 1.4% YoY
by Calculated Risk on 8/07/2020 03:51:00 PM
From the Association of American Railroads (AAR) Rail Time Indicators. Graphs and excerpts reprinted with permission.
U.S. rail traffic in July was mixed, but overall it pointed to continued slow recovery (especially when coal is out of the picture) from April’s low point. Total U.S. originated carloads averaged 208,403 per week in July 2020, the most since March 2020 but also by far the lowest for July since prior to 1988, when our data begin. July’s decline was 17.6%, the smallest decline since March 2020. Excluding coal, U.S. carloads were down 12.7% in July
emphasis added
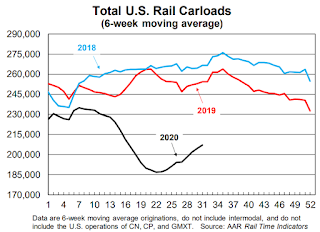 Click on graph for larger image.
This graph from the Rail Time Indicators report shows the six week average of U.S. Carloads in 2018, 2019 and 2020:
Total originated carloads on U.S. railroads averaged 208,403 per week in July 2020. That’s the most since March 2020, but it’s also by far the lowest weekly average for July since our records begin in 1988. Total carloads were down 17.6% in July 2020 from July 2019. That’s the 18th straight year-over-year decline but the smallest percentage decline since March 2020. Total carloads in the first seven months of 2020 were down 16.2%, or 1.27 million carloads.
 The second graph shows the six week average of U.S. intermodal in 2018, 2019 and 2020: (using intermodal or shipping containers):
U.S. intermodal. originations were down just 1.4% in July 2020 from July 2019, their best performance since February 2019. Weekly average originations in July 2020 were 259,192 containers and trailers, the most since October 2019 and a huge improvement from the 2020 low of 219.085 in April. Intermodal originations in the last week of July were 270,277, the most for any week in 2020.Note that rail traffic was weak prior to the pandemic.
Las Vegas Visitor Authority: No Convention Attendance, Visitor Traffic Down 70% YoY in June
by Calculated Risk on 8/07/2020 02:38:00 PM
From the Las Vegas Visitor Authority: June 2020 Las Vegas Visitor Statistics
With several gaming properties gradually re‐opening at varying capacities and on staggered dates after June 4, the destination hosted an estimated 1.1M visitors, roughly 30% of last June's visitation. With continued mandated restrictions on group sizes, no measurable convention attendance occurred during the month.Here is the data from the Las Vegas Convention and Visitors Authority.
Based on the destination's room inventory of 95,396 rooms* (excluding temporary closures), total occupancy reached 40.9% for the month with weekend occupancy coming in at 51.8% and midweek occupancy of 36.5%.
* Reflects weighted average of daily room tallies of open properties, i.e., approx. 22k rooms on Jun 1, 2 & 3, increasing to roughly 90k rooms on June 4 and eventually reaching approx. 115k in the latter days of the month
 Click on graph for larger image.
 The blue and red bars are monthly visitor traffic (left scale) for 2019 and 2020. The dashed blue and orange lines are convention attendance (right scale).
Convention traffic in June was down 100% compared to June 2019.
And visitor traffic was down 70% YoY.
The casinos started to reopen on June 4th, but visitor traffic is down significantly from last year.
Hotels: Occupancy Rate Declined 35% Year-over-year
by Calculated Risk on 8/07/2020 01:21:00 PM
From HotelNewsNow.com: STR: US hotel results for week ending 1 August
U.S. hotel performance data for the week ending 1 August showed slightly higher occupancy and room rates from the previous week, according to STR.The following graph shows the seasonal pattern for the hotel occupancy rate using the four week average.
26 July through 1 August 2020 (percentage change from comparable week in 2019):
• Occupancy: 48.9% (-34.5%)
• Average daily rate (ADR): US$100.04 (-25.3%)
• Revenue per available room (RevPAR): US$48.96 (-51.1%)
U.S. occupancy has risen week over week for 15 of the last 16 weeks, although growth in demand (room nights sold) has slowed.
emphasis added
As STR noted, the occupancy rate has increased week-to-week in "15 of the last 16 weeks". The increases in occupancy have slowed and are well below the level for this week last year of 75%.
 Click on graph for larger image.
The red line is for 2020, dash light blue is 2019, blue is the median, and black is for 2009 (the worst year probably since the Great Depression for hotels).
According to STR, most of the improvement appears related to leisure travel as opposed to business travel. The leisure travel season usually peaks at the beginning of August (right now), and the occupancy declines sharply in the Fall.
Note: Y-axis doesn't start at zero to better show the seasonal change.
Black Knight: Number of Homeowners in COVID-19-Related Forbearance Plans Decreased Due to Expirations
by Calculated Risk on 8/07/2020 11:15:00 AM
Note: Both Black Knight and the MBA (Mortgage Bankers Association) are putting out weekly estimates of mortgages in forbearance.
This data is as of Monday, August 3rd.
The usual forbearance period is 3 months, and a large number of mortgage holders have had there forbearance period extended an additional 3 months.
From “Echo wave” of forbearance expirations
The latest data from the McDash Flash Forbearance Tracker shows that, improving upon last week’s decline, the number of active forbearance plans fell by 101,000 from the week prior, driven in part by the estimated 500,000 plans that were set to expire at the end of July entering the last week of the month.
More than two-thirds of loans that remain in active forbearance have had their plans extended. With the bulk of forbearance extensions being for an additional three months, an ‘echo wave’ of forbearance expirations has been generated.
For context, entering June, nearly 2.5 million plans were set to expire in that month. Given the typical 3-month extensions 2.2 million are now set to expire in September, meaning another wave of forbearance extensions and removals may very well be seen in late September/early October.
...
As of August 3, approximately 4 million homeowners were in active forbearance, the lowest such share since the last week in April and representing 7.5% of all active mortgages, down from 7.7% the week prior. Together, they represent $852 billion in unpaid principal.
Spikes in COVID-19 around much of the country and the expiration of expanded unemployment benefits at the end of July both represent significant uncertainty for the weeks ahead. Black Knight will continue to monitor the situation and provide updates via this blog. emphasis added
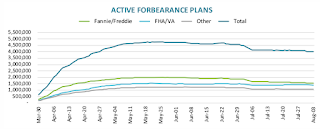 Click on graph for larger image.
CR Note: There will be another disaster relief package soon, but we might see an increase in forbearance activity in the coming weeks as we wait for additional relief.
Comments on July Employment Report
by Calculated Risk on 8/07/2020 09:16:00 AM
The labor market swings have been huge, and the July employment report was somewhat better than expected with 1.8 million jobs added.
Leisure and hospitality led the way with 592 thousand jobs added in July, following 3.386 million jobs added in May and June. Leisure and hospitality lost 8.318 million jobs in March and April, so about 48% of those jobs were added back in May, June and July.
Earlier: July Employment Report: 1.8 Million Jobs Added, 10.2% Unemployment Rate
In July, the year-over-year employment change was minus 11.4 million jobs.
As expected, there were 27 thousand temporary Decennial Census workers hired (and included in this report). This will surge over the next two to three months. "A July job gain in federal government (+27,000) reflected the hiring of temporary workers for the 2020 Census."
State and local education declined 960 thousand in July NSA (Not Seasonally Adjusted). This was much more than expected, and this resulted an increase of only 245 thousand jobs SA (Seasonally Adjusted). This means state and local governments are cutting education much more than expected due to budget constraints. I'll have more on this later.
Permanent Job Losers
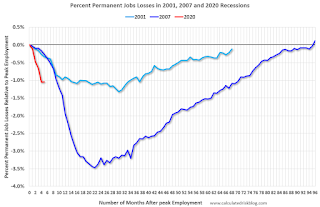
This graph shows permanent job losers as a percent of the pre-recession peak in employment through the July report. (ht Joe Weisenthal at Bloomberg)
This data is only available back to 1994, so there is only data for three recessions.
In July, the number of permanent job losers was essentially unchanged from June.
Prime (25 to 54 Years Old) Participation

The prime working age will be key in the eventual recovery.
The 25 to 54 participation rate decreased in July to 81.3%, and the 25 to 54 employment population ratio increased slightly to 73.8%.
Part Time for Economic Reasons

"The number of persons employed part time for economic reasons (sometimes referred to as involuntary part-time workers) declined by 619,000 to 8.4 million in July, reflecting a decline in the number of people whose hours were cut due to slack work or business conditions (-658,000). The number of involuntary part-time workers is 4.1 million higher than in February."The number of persons working part time for economic reasons decreased in July to 8.443 million from 9.062 million in June.
These workers are included in the alternate measure of labor underutilization (U-6) that decreased to 16.5% in July. This is down from the record high in April 22.8% for this measure since 1994. The previous peak was 17.2% during the Great Recession.
Unemployed over 26 Weeks
 This graph shows the number of workers unemployed for 27 weeks or more.
 According to the BLS, there are 1.501 million workers who have been unemployed for more than 26 weeks and still want a job. This will increase sharply in 2 or 3 months, and will be a key measure to follow during the recovery.
Summary:
The headline monthly jobs number was above expectations and the previous two months were revised up 18,000 combined. The headline unemployment rate decreased to 10.2%.
As a reminder, the course of the economy will be determined by the course of the pandemic.
July Employment Report: 1.8 Million Jobs Added, 10.2% Unemployment Rate
by Calculated Risk on 8/07/2020 08:41:00 AM
From the BLS:
Total nonfarm payroll employment rose by 1.8 million in July, and the unemployment rate fell to 10.2 percent, the U.S. Bureau of Labor Statistics reported today. These improvements in the labor market reflected the continued resumption of economic activity that had been curtailed due to the coronavirus (COVID-19) pandemic and efforts to contain it. In July, notable job gains occurred in leisure and hospitality, government, retail trade, professional and business services, other services, and health care.
...
The change in total nonfarm payroll employment for May was revised up by 26,000, from +2,699,000 to +2,725,000, and the change for June was revised down by 9,000, from +4,800,000 to +4,791,000. With these revisions, employment in May and June combined was 17,000 higher than previously reported.
emphasis added
 Click on graph for larger image.
The first graph shows the year-over-year change in total non-farm employment since 1968.
In July, the year-over-year change was -11.371 million jobs.
Total payrolls increased by 1.8 million in July.
Payrolls for May and June were revised up 17 thousand combined.
 The second graph shows the job losses from the start of the employment recession, in percentage terms.
The current employment recession is by far the worst recession since WWII in percentage terms, and the worst in terms of the unemployment rate.
The third graph shows the employment population ratio and the participation rate.
 The Labor Force Participation Rate decreased to 61.4% in July. This is the percentage of the working age population in the labor force.
 The Employment-Population ratio increased to 55.1% (black line).
I'll post the 25 to 54 age group employment-population ratio graph later.
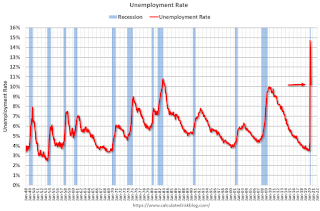 The fourth graph shows the unemployment rate.
 The unemployment rate decreased in July to 10.2%.
This was above consensus expectations of 1.58 million jobs added, and May and June were revised up by 18,000 combined.
I'll have much more later …


