by Calculated Risk on 4/05/2020 05:09:00 PM
Sunday, April 05, 2020
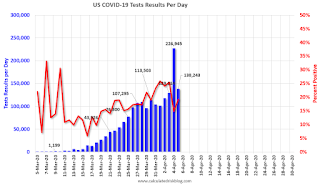
April 5 Update: US COVID-19 Test Results
Note: the large increase yesterday in test results reported was due to California working through the backlog of pending tests.
Test-and-trace is a key criteria in starting to reopen the country. My current guess is test-and-trace will require around 300,000 tests per day at first since the US is far behind the curve. Some scientists believe we need around 800,000 tests per day.
Notes: Data for the previous couple of days is updated and revised, so graphs might change.
Also, I'm no longer including pending tests. So this is just test results reported daily.
There were 138,243 test results reported over the last 24 hours.

This data is from the COVID Tracking Project.
The percent positive over the last 24 hours was 19% (red line). The US needs enough tests to push the percentage below 5% (probably much lower).
Test. Test. Test. Protect healthcare workers first!
Saturday, April 04, 2020
April 4 Update: US COVID-19 Test Results Increase; California to Increase Testing Fivefold
by Calculated Risk on 4/04/2020 05:59:00 PM
From the LA Times: Gov. Gavin Newsom said he ‘owns’ coronavirus testing lapses, announces task force
In a Saturday news conference, Newsom announced a task force that he said will work toward a fivefold increase in daily testing in the state by identifying supply shortages and adding testing locations.Test-and-trace is a key criteria in starting to reopen the country. My current guess is test-and-trace will require around 300,000 tests per day at first since the US is far behind the curve. Some scientists believe we need around 800,000 tests per day.
The announcement comes as California continues to see dramatic increases in people hospitalized with the virus, with 2,300 patients in the state. Another 3,267 people hospitalized are suspected of having COVID-19, but are awaiting testing results.
Overnight, the number of coronavirus patients in California’s intensive care unit beds rose nearly 11% to 1,008 people.
In all, Newsom said 126,700 people have been tested in California, a state of nearly 40 million people. Of those who have been tested, 13,000 are awaiting results.
Notes: Data for the previous couple of days is updated and revised, so graphs might change.
Also, I'm no longer including pending tests. So this is just test results reported daily.
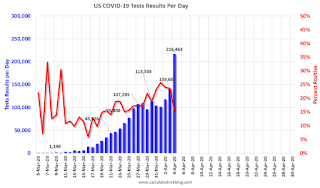
There were 216,463 test results reported over the last 24 hours.
 Click on graph for larger image.
This data is from the COVID Tracking Project.
The percent positive over the last 24 hours was 16% (red line). The US needs enough tests to push the percentage below 5%.
Test. Test. Test. Protect healthcare workers first!
Schedule for Week of April 5, 2020
by Calculated Risk on 4/04/2020 08:11:00 AM
The key report this week is the March CPI.
The FOMC minutes on Wednesday might be interesting.
No major economic releases scheduled.
 10:00 AM ET: Job Openings and Labor Turnover Survey for February from the BLS.
 This graph shows job openings (yellow line), hires (purple), Layoff, Discharges and other (red column), and Quits (light blue column) from the JOLTS.
Jobs openings increased in January to 6.963 million from 6.552 million in December.
The number of job openings (yellow) were down 7% year-over-year, and Quits were up slightly year-over-year.
10:00 AM: Corelogic House Price index for February.
3:00 PM: Consumer Credit from the Federal Reserve.
7:00 AM ET: The Mortgage Bankers Association (MBA) will release the results for the mortgage purchase applications index.
2:00 PM: FOMC Minutes, Meeting of March 15, 2020
8:30 AM: The initial weekly unemployment claims report will be released. The consensus is for a 5.000 million initial claims, down from 6.648 million the previous week.
8:30 AM: The Producer Price Index for March from the BLS. The consensus is for a 0.3% decrease in PPI, and a 0.1% increase in core PPI.
10:00 AM: University of Michigan's Consumer sentiment index (Preliminary for April).
8:30 AM: The Consumer Price Index for March from the BLS. The consensus is for 0.3% decrease in CPI, and a 0.1% increase in core CPI.
The NYSE and the NASDAQ will be closed for Good Friday.
Friday, April 03, 2020
April 3 Update: US COVID-19 Test Results per Day; More Testing Needed
by Calculated Risk on 4/03/2020 05:02:00 PM
Germany is conducting 50,000 tests per day, and scientists are advising Germany to increase testing to 200,000 per day.
The population of Germany is 83 million, about one-fourth of the US. To match Germany's current testing level, the US needs 200,000 tests per day, and the US needs four times that many based on the advice of some scientists.
The US testing shortfall continues. We need someone in charge resolving any bottleneck issues - PPE, manpower, swabs, reagents - whatever the issue, someone needs to be fixing it.
Test-and-trace is a key criteria in starting to reopen the country. My current guess is test-and-trace will require around 300,000 tests per day at first since the US is far behind the curve.
Notes: Data for the previous couple of days is updated and revised, so graphs might change.
Also, I'm no longer including pending tests. So this is just test results reported daily.
There were 139,613 test results reported over the last 24 hours.

This data is from the COVID Tracking Project.
The percent positive over the last 24 hours was 24% (red line). The US needs enough tests to push the percentage below 5%.
Test. Test. Test. Protect healthcare workers first!
AAR: March Rail Carloads down 6.0% YoY, Intermodal Down 12.2% YoY
by Calculated Risk on 4/03/2020 03:31:00 PM
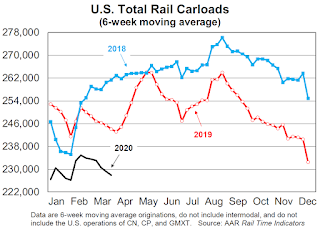
Note: The graphs are six week averages, and the economy was very different at the end of March - so next month we will see a sharp decline in traffic due to COVID-19.
From the Association of American Railroads (AAR) Rail Time Indicators. Graphs and excerpts reprinted with permission.
A confluence of factors caused weekly average U.S. rail carloads in March 2020 to fall to their lowest level since sometime before January 1988, when our data begin. Total U.S. carloads in March 2020 were down 6.0% from March 2019 and down 3.0% from February 2020. Meanwhile, U.S. intermodal volume in March 2020 was down 12.2% from March 2019 (its biggest year-over-year percentage decline since September 2009) and down 6.3% from February 2020.
The clearest example so far of the impact of the coronavirus on rail volumes involves autos and auto parts: combined U.S., Canadian, and Mexican carloads were 25,518 in the third week of March, but only 9,745 carloads — a 62% decline — the following week, thanks to widespread auto plant shutdowns. Intermodal also suffered from fewer containers of auto parts.
emphasis added
 Click on graph for larger image.
This graph from the Rail Time Indicators report shows the six week average of U.S. Carloads in 2018, 2019 and 2020:
The U.S. economy in the last week of March was very different from what it was in the first week of March. It’s the same with some rail commodities.
Total originated carloads on U.S. railroads in March 2020 were 57,148 carloads, or 6.0%, lower than in March 2019. That’s their 14th consecutive year-overyear decline. Total carloads averaged 224,918 per week in March 2020, supplanting February 2020 as the lowest-volume month since sometime prior to January 1988, when our data begin.
 The second graph shows the six week average of U.S. intermodal in 2018, 2019 and 2020: (using intermodal or shipping containers):
U.S. intermodal originations fell 12.2% in March 2020 from March 2019, their biggest year-over- year percentage decline since September 2009. Weekly average intermodal volume in March 2020 (233,845 units) was the lowest for March since 2013. What happens at Western ports will have a big impact on intermodal. Some say China is returning to normal, removing a supply shock that reduced sailings to the U.S and related intermodal shipments. However, some analysts fear that a demand shock is coming as U.S. importers cancel shipments because they don’t think they’ll be able to sell them. The only sure thing is that nobody knows for sure what’s going to happen.
CDC: Seasonal Flu Activity Decreased Sharply, Now "Low"
by Calculated Risk on 4/03/2020 02:10:00 PM
Seasonal flu activity has slowed sharply, and is now low, and that will help with the rapidly increasing COVID-19 pandemic.
From the CDC: Weekly U.S. Influenza Surveillance Report
Laboratory confirmed flu activity as reported by clinical laboratories continues to decrease sharply and is now low. Influenza-like illness activity, while lower than last week, is still elevated..Note that ILI (influenza-like illness) activity is elevated due to COVID-19.
…
Nationally, the percent of laboratory specimens testing positive for influenza at clinical laboratories continued to decrease and is now low. … Recent changes in healthcare seeking behavior, including increasing use of telemedicine and recommendations to limit emergency department (ED) visits to severe illness, as well as increasing levels of social distancing, are affecting the number of persons with ILI and their reasons for seeking care in outpatient and ED settings.
 Click on graph for larger image.
This graph from the CDC shows the number of positive specimens, and the percent of tests positive.
If we look back at previous reports (for week 13), activity slowed faster this year than in most previous years.
Influenza is seasonal, but social distancing has helped lower flu activity too.
And fewer patients with the flu is a positive for healthcare workers.
Comments on March Employment Report
by Calculated Risk on 4/03/2020 11:11:00 AM
The March report was much worse than expected (due to uncertainty about the timing of layoffs), but the report is already "stale". The April report will be much worse with job losses in the millions (The April report will show the most job losses ever).
The headline number for March was 701 thousand jobs lost, and the previous two months were revised down 57 thousand, combined. The unemployment rate increased to 4.4%. The BLS noted many issues with the employment report this month (see Frequently asked questions: The impact of the coronavirus (COVID-19) pandemic on The Employment Situation for March 2020) and it appears the unemployment rate might be a percentage point higher (but that will seem like a small error next month).
Earlier: March Employment Report: 701,000 Jobs Lost (718,000 Lost ex-Census), 4.4% Unemployment Rate
In March, the year-over-year employment change was 1.504 million jobs including Census hires. The year-over-year change will turn negative next month.
"Scariest Job Chart Ever"
During the Great Recession, I posted a graph each month comparing the percentage job losses to previous recessions. This became known as the "scariest job chart".

Here is an updated version of the scariest chart. The 2020 Sudden Stop is in Red (just one month) - next month will be stunning.
The Great Recession is in blue. What made the 2007 recession so scary, was both the depth and duration of the job losses.
The 2020 recession will have the sharpest decline in jobs, but we don't know about the duration of the losses. Duration will depend on the battle against the virus.
Average Hourly Earnings
Wage growth was at expectations. From the BLS:
"In March, average hourly earnings for all employees on private nonfarm payrolls increased by 11 cents to $28.62. Over the past 12 months, average hourly earnings have increased by 3.1 percent."
 This graph is based on “Average Hourly Earnings” from the Current Employment Statistics (CES) (aka "Establishment") monthly employment report. Note: There are also two quarterly sources for earnings data: 1) “Hourly Compensation,” from the BLS’s Productivity and Costs; and 2) the Employment Cost Index which includes wage/salary and benefit compensation.
The graph shows the nominal year-over-year change in "Average Hourly Earnings" for all private employees. Nominal wage growth was at 3.1% YoY in March.
Prime (25 to 54 Years Old) Participation
 Since the overall participation rate has declined due to cyclical (recession) and demographic (aging population, younger people staying in school) reasons, here is the employment-population ratio for the key working age group: 25 to 54 years old.
In the earlier period the participation rate for this group was trending up as women joined the labor force. Since the early '90s, the participation rate moved more sideways, with a downward drift starting around '00 - and with ups and downs related to the business cycle.
The 25 to 54 participation rate decreased in March to 82.6%, and the 25 to 54 employment population ratio decreased to 79.6%.
Part Time for Economic Reasons
 From the BLS report:
"The number of persons employed part time for economic reasons, at 5.8 million, increased by 1.4 million in March. These individuals, who would have preferred full-time employment, were working part time because their hours had been reduced or they were unable to find full-time jobs."The number of persons working part time for economic reasons increased sharply in March to 5.765 million from 4.318 million in February.
These workers are included in the alternate measure of labor underutilization (U-6) that increased to 8.7% in March.
Unemployed over 26 Weeks
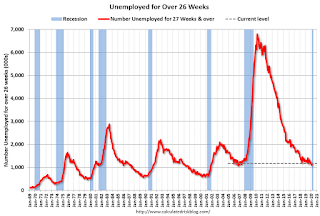
 This graph shows the number of workers unemployed for 27 weeks or more.
 According to the BLS, there are 1.164 million workers who have been unemployed for more than 26 weeks and still want a job. This was up from 1.102 million in February.
Summary:
The headline jobs number was well below expectations, and the previous two months were revised down. The headline unemployment rate increased to 4.4%. These are horrible numbers, but the report for April will be much worse.
ISM Non-Manufacturing Index decreased to 52.5% in March
by Calculated Risk on 4/03/2020 10:05:00 AM
The March ISM Non-manufacturing index was at 52.5%, down from 57.3% in February. The employment index decreased to 47.0%, from 55.6%. Note: Above 50 indicates expansion, below 50 contraction.
From the Institute for Supply Management: March 2020 Non-Manufacturing ISM Report On Business®
Economic activity in the non-manufacturing sector grew in March for the 122nd consecutive month, say the nation's purchasing and supply executives in the latest Non-Manufacturing ISM® Report On Business.®This is just the beginning of the down turn. The numbers will be much worse in the April report.
The report was issued today by Anthony Nieves, CPSM, C.P.M., A.P.P., CFPM, Chair of the Institute for Supply Management® (ISM®) Non-Manufacturing Business Survey Committee: “The NMI® registered 52.5 percent, 4.8 percentage points lower than the February reading of 57.3 percent. This represents continued growth in the non-manufacturing sector, at a slower rate. The Non-Manufacturing Business Activity Index decreased to 48 percent, 9.8 percentage points lower than the February reading of 57.8 percent, reflecting contraction for the first time since July 2009, when the index registered 47.2 percent. The New Orders Index registered 52.9 percent, 10.2 percentage points below the reading of 63.1 percent in February. The Employment Index decreased 8.6 percentage points to 47 percent from the February reading of 55.6 percent.
emphasis added
March Employment Report: 701,000 Jobs Lost (718,000 Lost ex-Census), 4.4% Unemployment Rate
by Calculated Risk on 4/03/2020 08:44:00 AM
From the BLS:
Total nonfarm payroll employment fell by 701,000 in March, and the unemployment rate rose to 4.4 percent, the U.S. Bureau of Labor Statistics reported today. The changes in these measures reflect the effects of the coronavirus (COVID-19) and efforts to contain it. Employment in leisure and hospitality fell by 459,000, mainly in food services and drinking places. Notable declines also occurred in health care and social assistance, professional and business services, retail trade, and construction.
...
Federal government employment rose by 18,000 in March, reflecting the hiring of 17,000 workers for the 2020 Census.
...
The change in total nonfarm payroll employment for January was revised down by 59,000 from +273,000 to +214,000, and the change for February was revised up by 2,000 from +273,000 to +275,000. With these revisions, employment gains in January and February combined were 57,000 lower than previously reported.
...
In March, average hourly earnings for all employees on private nonfarm payrolls increased by 11 cents to $28.62. Over the past 12 months, average hourly earnings have increased by 3.1 percent.
emphasis added
 Click on graph for larger image.
The first graph shows the monthly change in payroll jobs, ex-Census (meaning the impact of the decennial Census temporary hires and layoffs is removed - mostly in 2010 - to show the underlying payroll changes).
Total payrolls decreased by 718 thousand in March ex-Census (private payrolls decreased 713 thousand).
Payrolls for January and February were revised down 57 thousand combined.
 This graph shows the year-over-year change in total non-farm employment since 1968.
In March, the year-over-year change was 1.504 million jobs.
The third graph shows the employment population ratio and the participation rate.
 The Labor Force Participation Rate was decreased to 62.7% in March. This is the percentage of the working age population in the labor force. A large portion of the recent decline in the participation rate is due to demographics and long term trends.
The Employment-Population ratio decreased to 60.0% (black line).
I'll post the 25 to 54 age group employment-population ratio graph later.
 The fourth graph shows the unemployment rate.
 The unemployment rate increased in March to 4.4%.
This was well below consensus expectations of 100,000 jobs lost, and January and February were revised down by 57,000 combined.
This was a horrible employment report, and the report for April will be much worse. I'll have much more later ...
Thursday, April 02, 2020
Friday: Employment Report
by Calculated Risk on 4/02/2020 10:25:00 PM
Friday:
My March Employment Preview.
Goldman's March Payrolls preview.
Friday:
• At 8:30 AM ET, Employment Report for March. The consensus is for 100,000 jobs lost, and for the unemployment rate to increase to 3.9%.
• At 10:00 AM, the ISM non-Manufacturing Index for March. The consensus is for a reading of 48.1, down from 57.3.


