 RSS Feed
 by Calculated Risk on 3/30/2020 10:03:00 AM
Monday, March 30, 2020
NAR: "Pending Home Sales Increase 2.4% in February"
From the NAR: Pending Home Sales Increase 2.4% in February
ending home sales rose in February, climbing for the second consecutive month, according to the National Association of Realtors®. Each of the four major regions saw an increase in month-over-month contract activity, as well as growth in year-over-year pending home sales transactions compared to one year ago.This was well above expectations for this index. Note: Contract signings usually lead sales by about 45 to 60 days, so this would usually be for closed sales in March and April. Some of these sales will be cancelled or delayed due to COVID-19.
The Pending Home Sales Index (PHSI), a forward-looking indicator based on contract signings, grew 2.4% to 111.5 in February. Year-over-year contract signings increased 9.4%. An index of 100 is equal to the level of contract activity in 2001.
...
The Northeast PHSI rose 2.8% to 96.3 in February, 5.9% higher than a year ago. In the Midwest, the index increased 4.5% to 110.1 last month, 14.9% higher than in February 2019.
Pending home sales in the South inched up 0.1% to an index of 129.2 in February, a 7.1% increase from February 2019. The index in the West grew 4.6% in February 2020 to 97.1, a jump of 10.8% from a year ago.
emphasis added
Sunday, March 29, 2020
Sunday Night Futures: Oil Prices Lowest Since Feb 2002
by Calculated Risk on 3/29/2020 07:18:00 PM
Weekend:
• Schedule for Week of March 29, 2020
Monday:
• At 10:00 AM ET, Pending Home Sales Index for February. The consensus is for a 1.0% decrease in the index.
• At 10:30 AM, Dallas Fed Survey of Manufacturing Activity for March. This is the last of the regional surveys for March.
From CNBC: Pre-Market Data and Bloomberg futures S&P 500 are down 50 and DOW futures are down 409 (fair value).
Oil prices were down over the last week with WTI futures at $20.33 per barrel and Brent at $23.54 barrel. A year ago, WTI was at $60, and Brent was at $68 - so oil prices are down almost two-thirds year-over-year.
This is the lowest for WTI since February 25, 2002 (oil prices declined following 9/11)
Here is a graph from Gasbuddy.com for nationwide gasoline prices. Nationally prices are at $1.96 per gallon. A year ago prices were at $2.70 per gallon, so gasoline prices are down 74 cents per gallon year-over-year.
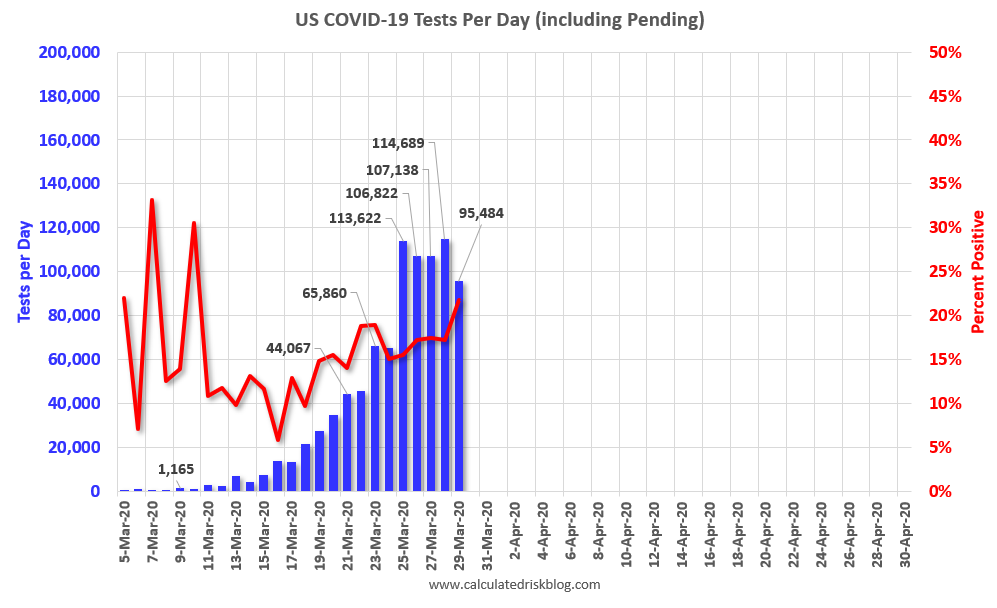
March 29 Update: US COVID-19 Tests per Day #TestAndTrace
by Calculated Risk on 3/29/2020 06:02:00 PM
I strongly recommend reading this plan from Dr. Scott Gottlieb, Caitlin Rivers et, al.: National coronavirus response: A road map to reopening and an op-ed in the WaPo: Experts converge on plans for easing coronavirus restrictions safely.
We are currently in "Phase I: Slow the Spread". To move to Phase II, the authors suggest:
Trigger for Moving to Phase IISo Test-and-trace is a key criteria to moving to Phase II. My current guess is test-and-trace will require around 300,000 tests per day.
A state can safely proceed to Phase II when it has achieved all the following:
• A sustained reduction in cases for at least 14 days,
• Hospitals in the state are safely able to treat all patients requiring hospitalization without resorting to crisis standards of care,
• The state is able to test all people with COVID-19 symptoms, and
• The state is able to conduct active monitoring of confirmed cases and their contacts.
When I first started posting this data (thanks to the COVID Tracking Project), testing was so low, that just tracking the number of tests made sense.
The percentage positive is also critical. Unfortunately some states and labs don't report all negative tests, although that is supposed to change soon.
The real key is to have enough tests that the US can test all people with symptoms (even mild), all close contacts of those testing positive (aka Test-and-Trace), healthcare workers and first responders fairly regularly (upon request), staff at retirement communities and nursing homes, and those people that regularly visit those facilities (it is a burden on older people not see their families).
Notes: Data for the previous couple of days is updated and revised, so graphs might change.
Also, I include all tests in the total including pending.
The percent positive excludes the pending tests.
There were 95,484 tests reported over the last 24 hours.
 Click on graph for larger image.
This data is from the COVID Tracking Project.
The percent positive over the last 24 hours was 22%.
Testing must continue to be expanded until the percent positive declines to 5% or lower. This is based on results from South Korea.
Test. Test. Test.
March 2020: Unofficial Problem Bank list Increased to 65 Institutions
by Calculated Risk on 3/29/2020 09:57:00 AM
The FDIC's official problem bank list is comprised of banks with a CAMELS rating of 4 or 5, and the list is not made public (just the number of banks and assets every quarter). Note: Bank CAMELS ratings are also not made public.
CAMELS is the FDIC rating system, and stands for Capital adequacy, Asset quality, Management, Earnings, Liquidity and Sensitivity to market risk. The scale is from 1 to 5, with 1 being the strongest.
As a substitute for the CAMELS ratings, surferdude808 is using publicly announced formal enforcement actions, and also media reports and company announcements that suggest to us an enforcement action is likely, to compile a list of possible problem banks in the public interest.
DISCLAIMER: This is an unofficial list, the information is from public sources and while deemed to be reliable is not guaranteed. No warranty or representation, expressed or implied, is made as to the accuracy of the information contained herein and same is subject to errors and omissions. This is not intended as investment advice. Please contact CR with any errors.
Here is the unofficial problem bank list for March 2020.
Here are the monthly changes and a few comments from surferdude808:
Update on the Unofficial Problem Bank List for March 2020. During the month, the list increased by two to 65 institutions two additions. Assets increased by $93 million to $48.6 billion. A year ago, the list held 72 institutions with assets of $51.6 billion. Added this month was Mutual Savings Bank, Hartsville, SC ($52 million) and Ford County State Bank, Spearville, KS ($41 million). Also, the FDIC updated actions against Southwest Capital Bank, Albuquerque, NM ($339 million) and California Business Bank, Irvine, CA ($83 million).The first unofficial problem bank list was published in August 2009 with 389 institutions. The number of unofficial problem banks grew quickly and peaked at 1,003 institutions in July, 2011 - and has steadily declined since then to well below 100 institutions.
With the conclusion of the first quarter, we bring an updated transition matrix to detail how banks are transitioning off the Unofficial Problem Bank List. Since the Unofficial Problem Bank List was first published on August 7, 2009 with 389 institutions, 1,760 institutions have appeared on a weekly or monthly list since the start of publication. Only 3.7 percent of the banks that have appeared on a list remain today as 1,695 institutions have transitioned through the list. Departure methods include 1,000 action terminations, 409 failures, 267 mergers, and 19 voluntary liquidations. Of the 389 institutions on the first published list, only 5 or 1.3 percent, are still designated as being in a troubled status more than ten years later. The 409 failures represent 23.2 percent of the 1,760 institutions that have made an appearance on the list. This failure rate is well above the 10-12 percent rate frequently cited in media reports on the failure rate of banks on the FDIC's official list.
Saturday, March 28, 2020
March 28 Update: US COVID-19 Tests per Day #TestAndTrace
by Calculated Risk on 3/28/2020 05:18:00 PM
It is one thing to finally have the capacity to do test-and-trace (not there yet). But we also need the infrastructure in place.
Questions to ask:
1. Who is in charge of the Test-and-trace taskforce?
2. Do we have the tools ready to go? (Software, database, etc)
3. Do we have the manpower trained? (Not healthcare workers)
4. Do we have tools ready to track those in self quarantine? South Korea calls people twice a day in quarantine to see how they are doing, if they need medical help or food, and to schedule a follow-up test when they are feeling better.
5. Do we have trained manpower to call people twice a day in quarantine?
When I first started posting this data (thanks to the COVID Tracking Project), testing was so low, that just tracking the number of tests made sense.
The percentage positive is also critical. Unfortunately some states and labs don't report all negative tests, although that is supposed to change soon.
The real key is to have enough tests that the US can test all people with symptoms (even mild), all close contacts of those testing positive (aka Test-and-Trace), healthcare workers and first responders fairly regularly (upon request), staff at retirement communities and nursing homes, and those people that regularly visit those facilities (it is a burden on older people not see their families).
Notes: Data for the previous couple of days is updated and revised, so graphs might change.
Also, I include all tests in the total including pending.
The percent positive excludes the pending tests.
There were 114,655 tests reported over the last 24 hours.
 Click on graph for larger image.
This data is from the COVID Tracking Project.
The percent positive over the last 24 hours was 17%.
Testing must continue to be expanded until the percent positive declines to 5% or lower. This is based on results from South Korea.
Test. Test. Test.
Note: 44 Medics have died in Italy. Protect our healthcare workers first (masks, gowns, shields, etc)!
Schedule for Week of March 29, 2020
by Calculated Risk on 3/28/2020 08:11:00 AM
The key report scheduled for this week is the March employment report on Friday.
Other key reports include January Case-Shiller house prices, the February Trade Deficit and March Auto Sales.
For manufacturing, the March Dallas Fed survey and the ISM Manufacturing survey will be released.
10:00 AM: Pending Home Sales Index for February. The consensus is for a 1.0% decrease in the index.
10:30 AM: Dallas Fed Survey of Manufacturing Activity for March. This is the last of the regional surveys for March.
 9:00 AM: S&P/Case-Shiller House Price Index for January.
This graph shows the nominal seasonally adjusted National Index, Composite 10 and Composite 20 indexes through the most recent report (the Composite 20 was started in January 2000).
The consensus is for a 3.2% year-over-year increase in the Comp 20 index for December.
9:45 AM: Chicago Purchasing Managers Index for March. The consensus is for a reading of 40.0, down from 49.0 in February.
7:00 AM ET: The Mortgage Bankers Association (MBA) will release the results for the mortgage purchase applications index.
8:15 AM: The ADP Employment Report for March. This report is for private payrolls only (no government). The consensus is for 154,000 payroll jobs lost in March, down from 183,000 added in February.
 10:00 AM: ISM Manufacturing Index for March. The consensus is for the ISM to be at 45.0, down from 50.1 in February.
Here is a long term graph of the ISM manufacturing index.
The PMI was at 50.1% in February, the employment index was at 46.9%, and the new orders index was at 49.8%
10:00 AM: Construction Spending for February. The consensus is for a 0.6% increase in construction spending.
 Late: Light vehicle sales for March. The consensus is for light vehicle sales to be 11.9 million SAAR in March, down from 16.8 million in February (Seasonally Adjusted Annual Rate).
This graph shows light vehicle sales since the BEA started keeping data in 1967. The dashed line is the February sales rate.
8:30 AM: The initial weekly unemployment claims report will be released. The consensus is for a 3.000 million initial claims, down from 3.283 million the previous week.
 8:30 AM: Trade Balance report for January from the Census Bureau.
 This graph shows the U.S. trade deficit, with and without petroleum, through the most recent report. The blue line is the total deficit, and the black line is the petroleum deficit, and the red line is the trade deficit ex-petroleum products.
The consensus is the trade deficit to be $40.0 billion. The U.S. trade deficit was at $45.3 billion in January.
 8:30 AM: Employment Report for March. The consensus is for 100,000 jobs lost, and for the unemployment rate to increase to 3.9%.
There were 273,000 jobs added in February, and the unemployment rate was at 3.5%.
This graph shows the year-over-year change in total non-farm employment since 1968.
In February, the year-over-year change was 2.409 million jobs.
10:00 AM: the ISM non-Manufacturing Index for March. The consensus is for a reading of 48.1, down from 57.3.
Friday, March 27, 2020
March 27 Update: US COVID-19 Tests per Day #TestAndTrace
by Calculated Risk on 3/27/2020 05:40:00 PM
When I first started posting this data (thanks to the COVID Tracking Project), testing was so low, that just tracking the number of tests made sense.
The percentage positive is also critical. Unfortunately some states and labs don't report all negative tests, although that is supposed to change soon.
The real key is to have enough tests that the US can test all people with symptoms (even mild), all close contacts of those testing positive (aka Test-and-Trace), healthcare workers and first responders fairly regularly (upon request), staff at retirement communities and nursing homes, and those people that regularly visit those facilities (it is a burden on older people not see their families).
Notes: Data for the previous couple of days is updated and revised, so graphs might change.
Also, I include all tests in the total including pending.
The percent positive excludes the pending tests.
There were 107,172 tests reported over the last 24 hours.
 Click on graph for larger image.
This data is from the COVID Tracking Project.
The percent positive over the last 24 hours was 17%.
Testing must continue to be expanded until the percent positive declines to 5% or lower. This is based on results from South Korea.
Test. Test. Test. But protect our healthcare workers first!
CDC: Seasonal Flu Activity Slowing
by Calculated Risk on 3/27/2020 12:02:00 PM
Seasonal flu activity is sharply, and that will help with the rapidly increasing COVID-19 pandemic.
From the CDC: Weekly U.S. Influenza Surveillance Report
Laboratory confirmed flu activity as reported by clinical laboratories continues to decrease; however, influenza-like illness activity is increasing. Influenza severity indicators remain moderate to low overall, but hospitalization rates differ by age group, with high rates among children and young adults.Note that ILI (influenza-like illness) activity is increasing due to COVID-19.
…
Nationally, the percent of laboratory specimens testing positive for influenza at clinical laboratories continued to decrease while ILI activity continued to increase. More people are seeking care for respiratory illness due to the ongoing COVID-19 pandemic.
 Click on graph for larger image.
This graph from the CDC shows the number of positive specimens, and the percent of tests positive.
If we look back at previous reports (for week 12), activity this year is slowing faster than in most previous years.
Influenza is seasonal, but social distancing is probably helping lower flu activity too. And fewer patients with the flu is a positive for healthcare workers.
Kansas City Fed: "Tenth District Services Activity Decreased Significantly"
by Calculated Risk on 3/27/2020 11:47:00 AM
Usually I don't cover the service surveys, but the regional surveys are timely and are showing the sharp decline in activity.
From the Kansas City Fed: Tenth District Services Activity Decreased Significantly
The Federal Reserve Bank of Kansas City released the March Services Survey today. According to Chad Wilkerson, vice president and economist at the Federal Reserve Bank of Kansas City, the survey revealed that Tenth District services activity decreased significantly in March to the lowest level in survey history (since 2014), and firms expected business activity to drop further in the future.A few survey comments:
“We saw a significant decrease in regional services activity as businesses were negatively affected by COVID-19, and firms expected more activity to drop off moving forward,” said Wilkerson. “Over 54 percent of firms expected lower levels of employment for 2020 due to COVID-19 and recent market volatility, and nearly 63 percent of contacts were concerned about cash availability.”
…
The month-over-month services composite index was -16 in March, the lowest posting since the survey started in 2014, and down significantly from 6 in February and 14 in January … Expectations for future services activity decreased sharply, and the expected composite index posted the worst change from a month ago in survey history, dropping from 23 to -30.
“Currently closed to public, thus no business, which is tolerable in the short-term, but would be problematic long-term.”
“With customers staying at home we have no sales. This may force us to shut down temporarily.”
“We need access to cash fast… business has dropped 95% in the last 4 days.”
“(Business activity) has dropped to basically zero. Until schools reopen we are going to greatly suffer. We have tremendous uncertainty - how long will this last - 1 month - 2 months - 6 months - it will bankrupt us eventually if it is prolonged.”
BLS: February Unemployment rates at New Series Lows in Six States
by Calculated Risk on 3/27/2020 10:14:00 AM
From the BLS: Regional and State Employment and Unemployment Summary
Unemployment rates were lower in February in 8 states, higher in 1 state, and stable in 41 states and the District of Columbia, the U.S. Bureau of Labor Statistics reported today. Eleven states had jobless rate decreases from a year earlier, 1 state had an increase, and 38 states and the District had little or no change. The national unemployment rate, 3.5 percent, was little changed over the month but was 0.3 percentage point lower than in February 2019.
...
North Dakota had the lowest unemployment rate in February, 2.2 percent, while Alaska had the highest rate, 5.8 percent. The rates in Alaska (5.8 percent), Idaho (2.7 percent), Illinois (3.4 percent), New York (3.7 percent), North Dakota (2.2 percent), and Washington (3.8 percent) set new series lows. (All state series begin in 1976.)
emphasis added
 Click on graph for larger image.
This graph shows the number of states (and D.C.) with unemployment rates at or above certain levels since January 1976.
At the worst of the great recession, there were 11 states with an unemployment rate at or above 11% (red).
Currently no has an unemployment rate at or above 6% (dark blue). Note that this is the first time since the series started in 1976 that Alaska has been below 6%. Three states and the D.C. have unemployment rates above 5%; Alaska, Louisiana, and Mississippi.
A total of fifteen states are at a series low: Alabama, Alaska, Arkansas, California, Colorado, Florida, Georgia, Idaho, Illinois, Maryland, Nevada, New York, North Dakota, Oregon, and Washington.


