by Calculated Risk on 2/23/2020 12:54:00 PM
Sunday, February 23, 2020
Quarterly Starts by Purpose and Design
Along with the monthly housing starts for January last week, the Census Bureau released Quarterly Starts by Purpose and Design through Q4 2019.
This graph shows the NSA quarterly intent for four start categories since 1975: single family built for sale, owner built (includes contractor built for owner), starts built for rent, and condos built for sale.

Single family starts built for sale (red) were up 18.1% in Q4 2019 compared to Q4 2018.
Owner built starts (orange) were up 15.8% year-over-year.
Condos built for sale were still near the record low.
The 'units built for rent' (blue) and were up 25.3% in Q4 2019 compared to Q4 2018.
Saturday, February 22, 2020
Schedule for Week of February 23, 2020
by Calculated Risk on 2/22/2020 08:11:00 AM
The key reports this week are January New Home sales and the second estimate of Q4 GDP.
Other key reports include Case-Shiller house prices and Personal Income and Outlays for January.
For manufacturing, the February Dallas, Richmond and Kansas City manufacturing surveys will be released.
8:30 AM ET: Chicago Fed National Activity Index for January. This is a composite index of other data.
10:30 AM: Dallas Fed Survey of Manufacturing Activity for February.
9:00 AM: FHFA House Price Index for December 2018. This was originally a GSE only repeat sales, however there is also an expanded index.
 9:00 AM: S&P/Case-Shiller House Price Index for December.
This graph shows the year-over-year change for the Case-Shiller National, Composite 10 and Composite 20 indexes, through the most recent report (the Composite 20 was started in January 2000).
The consensus is for a 2.8% year-over-year increase in the Comp 20 index for December.
10:00 AM: Richmond Fed Survey of Manufacturing Activity for February.
7:00 AM ET: The Mortgage Bankers Association (MBA) will release the results for the mortgage purchase applications index.
 10:00 AM: New Home Sales for January from the Census Bureau.
 This graph shows New Home Sales since 1963.
The dashed line is the sales rate for last month.
The consensus is for 715 thousand SAAR, up from 694 thousand in December.
8:30 AM: The initial weekly unemployment claims report will be released. The consensus is for 211 thousand initial claims, up from 210 thousand the previous week.
8:30 AM: Gross Domestic Product, 4th quarter 2019 (Second estimate). The consensus is that real GDP increased 2.1% annualized in Q4, unchanged from the advance estimate.
8:30 AM: Durable Goods Orders for January from the Census Bureau. The consensus is for a 1.5% decrease in durable goods orders.
11:00 AM: the Kansas City Fed manufacturing survey for February. This is the last of regional manufacturing surveys for February.
8:30 AM ET: Personal Income and Outlays for January. The consensus is for a 0.3% increase in personal income, and for a 0.3% increase in personal spending. And for the Core PCE price index to increase 0.2%.
9:45 AM: Chicago Purchasing Managers Index for February. The consensus is for a reading of 45.8, up from 42.9 in January.
10:00 AM: University of Michigan's Consumer sentiment index (Final for February). The consensus is for a reading of 100.9.
Friday, February 21, 2020
Hotels: Occupancy Rate Increases Year-over-year
by Calculated Risk on 2/21/2020 04:58:00 PM
From HotelNewsNow.com: STR: US hotel results for week ending 15 February
The U.S. hotel industry reported positive year-over-year results in the three key performance metrics during the week of 9-15 February 2020, according to data from STR.The following graph shows the seasonal pattern for the hotel occupancy rate using the four week average.
In comparison with the week of 10-16 February 2019, the industry recorded the following:
• Occupancy: +0.2% to 63.6%
• Average daily rate (ADR): +0.9% to US$133.55
• Revenue per available room (RevPAR): +1.2% to US$85.00
emphasis added
 Click on graph for larger image.
The red line is for 2020, dash light blue is 2019, blue is the median, and black is for 2009 (the worst year probably since the Great Depression for hotels).
2020 is off to a solid start, however, STR notes that the new coronavirus could have a significant negative impact on hotels.
Comments on January Existing Home Sales
by Calculated Risk on 2/21/2020 12:05:00 PM
Earlier: NAR: Existing-Home Sales Decreased to 5.46 million in January
A few key points:
1) Existing home sales were up 9.6% year-over-year (YoY) in January.
2) Inventory is very low, and was down 10.7% year-over-year (YoY) in January. Inventory always decreases sharply in December as people take their homes off the market for the holidays, and then inventory starts to increase in February and March.

3) Sales slumped at the end of 2018 and in January 2019 due to higher mortgage rates, the stock market selloff, and fears of an economic slowdown.
The comparison to January of last year will be the easiest for this year.
Note that existing home sales picked up somewhat in the second half of 2019 as interest rates declined.

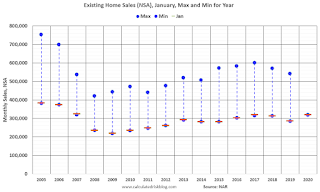
Sales NSA in January (318,000) were the highest for January since 2017.
Note that January sales (NSA) are always near the minimum for the year. The maximum is usually in June or July.
Overall this was a solid report. The very low level of inventory will be something to watch in 2020.
Q1 GDP Forecasts: 0.7% to 2.6%
by Calculated Risk on 2/21/2020 11:33:00 AM
From Merrill Lynch:
We are tracking 0.7% qoq saar for 1Q GDP and 2.0% for 4Q. [Feb 21 estimate]From Goldman Sachs:
emphasis added
we raised our Q1 GDP tracking estimate by one tenth to +1.5%. [Feb 19 estimate]From the NY Fed Nowcasting Report
The New York Fed Staff Nowcast stands at 2.0% for 2020:Q1. News from this week’s data increased the nowcast for 2020:Q1 by 0.6 percentage point. Positive surprises from regional survey and housing data drove most of the increase. [Feb 21 estimate]And from the Altanta Fed: GDPNow
The GDPNow model estimate for real GDP growth (seasonally adjusted annual rate) in the first quarter of 2020 is 2.6 percent on February 19, up from 2.4 percent on February 14. [Feb 19 estimate]CR Note: These early estimates suggest real GDP growth will be between 0.7% and 2.6% annualized in Q1.
NAR: Existing-Home Sales Decreased to 5.46 million in January
by Calculated Risk on 2/21/2020 10:12:00 AM
From the NAR: Existing-Home Sales Drop 1.3% in January
Existing-home sales declined in January, continuing a fluctuating pattern of monthly increases and declines, according to the National Association of Realtors®. Significant declines in the West region dragged down nationwide numbers, with the other three major U.S. regions reporting marginal – or no – changes last month.
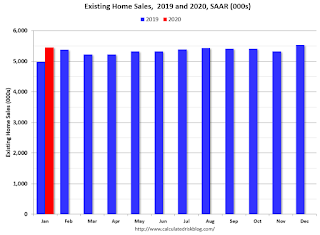
Total existing-home sales, completed transactions that include single-family homes, townhomes, condominiums and co-ops, decreased 1.3% from December to a seasonally-adjusted annual rate of 5.46 million in January. However, for the second straight month, overall sales substantially increased year-over-year, up 9.6% from a year ago (4.98 million in January 2019)..
...
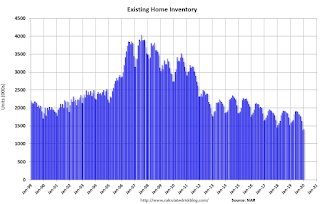
Total housing inventory at the end of January totaled 1.42 million units, up 2.2% from December, but down 10.7% from one year ago (1.59 million). The housing inventory level for January is the lowest level since 1999. Unsold inventory sits at a 3.1-month supply at the current sales pace, up from the 3.0-month figure recorded in December and down from the 3.8-month figure recorded in January 2019.
emphasis added
 Click on graph for larger image.
This graph shows existing home sales, on a Seasonally Adjusted Annual Rate (SAAR) basis since 1993.
Sales in January (5.46 million SAAR) were down 1.3% from last month, and were 9.6% above the January 2019 sales rate.
The second graph shows nationwide inventory for existing homes.
 According to the NAR, inventory increased to 1.42 million in January from 1.39 million in December. Headline inventory is not seasonally adjusted, and inventory usually decreases to the seasonal lows in December and January, and peaks in mid-to-late summer.
The last graph shows the year-over-year (YoY) change in reported existing home inventory and months-of-supply. Since inventory is not seasonally adjusted, it really helps to look at the YoY change. Note: Months-of-supply is based on the seasonally adjusted sales and not seasonally adjusted inventory.
 Inventory was down 10.7% year-over-year in January compared to January 2019.
 Months of supply increased to 3.1 months in January.
This was close to the consensus forecast. For existing home sales, a key number is inventory - and inventory is near record lows. I'll have more later …
Thursday, February 20, 2020
Friday: Existing Home Sales
by Calculated Risk on 2/20/2020 07:53:00 PM
Friday:
• At 10:00 AM, Existing Home Sales for January from the National Association of Realtors (NAR). The consensus is for 5.45 million SAAR, down from 5.54 million.
Housing economist Tom Lawler expects the NAR to report sales of 5.42 million SAAR.
Phoenix Real Estate in January: Sales up 18.1% YoY, Active Inventory Down 38.9% YoY
by Calculated Risk on 2/20/2020 12:40:00 PM
This is a key housing market to follow since Phoenix saw a large bubble / bust followed by strong investor buying.
The Arizona Regional Multiple Listing Service (ARMLS) reports ("Stats Report"):
1) Overall sales were at 6,328 in January, down from 7,585 in December, but up from 5,357 in January 2019. Sales were down 16.6% from December 2019 (last month), but up 18.1% from January 2019.
2) Active inventory was at 11,602, down from 18,990 in January 2019. That is down 38.9% year-over-year.
3) Months of supply increased to 2.54 in January from 2.05 months in December. This remains low.
This is another market with increasing sales and falling inventory.
Black Knight's First Look: National Mortgage Delinquency Rate Decreased in January, Lowest Level on Record
by Calculated Risk on 2/20/2020 10:15:00 AM
From Black Knight: Black Knight’s First Look: Mortgage Delinquencies Fall to Lowest Level on Record; January Sees Strongest Decline in More Than a Year
• Mortgage delinquencies fell by more than 5% in January, hitting their lowest level on record dating back to 2000According to Black Knight's First Look report for January, the percent of loans delinquent decreased in January compared to December, and decreased 14.2% year-over-year.
• January’s 14% year-over-year decline is the strongest in more than 12 months, with the rate of improvement picking up noticeably in recent months
• There are now fewer than 2 million homeowners past due on their mortgages or in active foreclosure, the fewest since March 2005
• Despite the decline in delinquencies, foreclosure starts edged upward in January, but remain nearly 15% below last year’s levels
• The number of loans in active foreclosure remained relatively flat for the month (+1,000 properties in foreclosure), and down 19,000 from the same time last year, leaving the national foreclosure rate unchanged
• Though falling by 15% in January, prepayment activity remains 113% above last year’s levels
The percent of loans in the foreclosure process increased slightly in January, and were down 9.2% over the last year.
Black Knight reported the U.S. mortgage delinquency rate (loans 30 or more days past due, but not in foreclosure) was 3.22% in December, down from 3.40% in December.
The percent of loans in the foreclosure process was unchanged at 0.46% from 0.46% in December.
| Black Knight: Percent Loans Delinquent and in Foreclosure Process | ||||
|---|---|---|---|---|
| Jan 2020 | Dec 2019 | Jan 2019 | Jan 2018 | |
| Delinquent | 3.22% | 3.40% | 3.75% | 4.31% |
| In Foreclosure | 0.46% | 0.46% | 0.51% | 0.66% |
| Number of properties: | ||||
| Number of properties that are delinquent, but not in foreclosure: | 1,705,000 | 1,803,000 | 1,945,000 | 2,202,000 |
| Number of properties in foreclosure pre-sale inventory: | 246,000 | 245,000 | 265,000 | 337,000 |
| Total Properties Delinquent or in foreclosure | 1,951,000 | 2,047,000 | 2,210,000 | 2,539,000 |
Philly Fed Manufacturing Suggests Activity Increased in February
by Calculated Risk on 2/20/2020 09:04:00 AM
From the Philly Fed: Current Manufacturing Indicators Suggest a Pickup in Growth in February
Manufacturing firms reported an improvement in regional manufacturing activity, according to results from the February Manufacturing Business Outlook Survey. The survey’s current indicators for general activity, new orders, and shipments increased this month, suggesting more widespread growth. The firms reported expansion in employment, although at a moderated pace from January. The survey’s broad future indexes also showed improvement this month, indicating that growth is expected to continue over the next six months.This was well above the consensus forecast. Here is a graph comparing the regional Fed surveys and the ISM manufacturing index:
The diffusion index for current general activity rose nearly 20 points this month to 36.7, its highest reading since February 2017 … The firms reported overall increases in manufacturing employment this month, but the current employment index decreased 10 points to 9.8. Just 18 percent of the firms reported higher employment, compared with 28 percent last month. The average workweek index, however, increased 5 points.
emphasis added
 Click on graph for larger image.
The New York and Philly Fed surveys are averaged together (yellow, through February), and five Fed surveys are averaged (blue, through January) including New York, Philly, Richmond, Dallas and Kansas City. The Institute for Supply Management (ISM) PMI (red) is through January (right axis).
These early reports suggest the ISM manufacturing index will be solidly in positive territory in February.


