 RSS Feed
 by Calculated Risk on 4/20/2019 08:11:00 AM
Saturday, April 20, 2019
Schedule for Week of April 21, 2019
The key reports this week are the advance estimate of Q1 GDP, and March New and Existing Home Sales.
For manufacturing, the April Richmond and Kansas City manufacturing surveys will be released.
8:30 AM ET: Chicago Fed National Activity Index for March. This is a composite index of other data.
 10:00 AM: Existing Home Sales for March from the National Association of Realtors (NAR). The consensus is for 5.30 million SAAR, down from 5.51 million.
The graph shows existing home sales from 1994 through the report last month.
Housing economist Tom Lawler expects the NAR to report sales of 5.40 million SAAR for March.
9:00 AM: FHFA House Price Index for February 2019. This was originally a GSE only repeat sales, however there is also an expanded index.
 10:00 AM: New Home Sales for March from the Census Bureau.
 This graph shows New Home Sales since 1963. The dashed line is the sales rate for last month.
The consensus is for 645 thousand SAAR, down from 667 thousand in February.
10:00 AM: Richmond Fed Survey of Manufacturing Activity for April.
7:00 AM ET: The Mortgage Bankers Association (MBA) will release the results for the mortgage purchase applications index.
8:30 AM: The initial weekly unemployment claims report will be released. The consensus is for 200 thousand initial claims, up from 192 thousand the previous week.
8:30 AM: Durable Goods Orders for March from the Census Bureau. The consensus is for a 0.8% increase in durable goods orders.
10:00 AM: the Q1 2019 Housing Vacancies and Homeownership from the Census Bureau.
8:30 AM: Gross Domestic Product, 1st quarter 2019 (Advance estimate). The consensus is that real GDP increased 2.0% annualized in Q1, down from 2.2% in Q4.
10:00 AM: University of Michigan's Consumer sentiment index (Final for April). The consensus is for a reading of 97.1.
Friday, April 19, 2019
Q1 GDP Forecasts: Around 2%
by Calculated Risk on 4/19/2019 11:57:00 AM
From Merrill Lynch:
Despite various distortions to begin 2019 (Government shutdown, inclement weather), we expect real GDP growth in the first quarter to be a solid 2.4% qoq saar, up slightly from 4Q 2018. [April 19 estimate]From the NY Fed Nowcasting Report
emphasis added
The New York Fed Staff Nowcast stands at 1.4% for 2019:Q1 and 1.9% for 2019:Q2. [Apr 19 estimate].And from the Altanta Fed: GDPNow
The GDPNow model estimate for real GDP growth (seasonally adjusted annual rate) in the first quarter of 2019 is 2.8 percent on April 19, unchanged from April 18 after rounding. After this morning’s new residential construction report from the U.S. Census Bureau, the nowcast of first-quarter real residential investment growth inched down from 4.0 percent to 3.5 percent. [Apr 19 estimate]CR Note: These estimates suggest real GDP growth will be around 2% annualized in Q1.
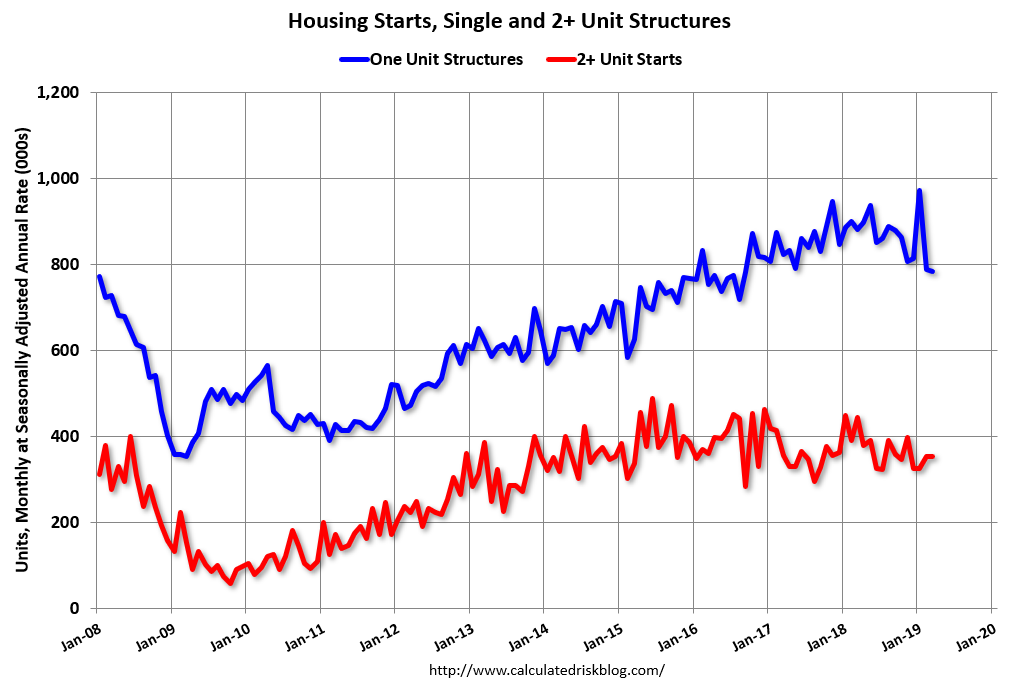
Comments on February Housing Starts
by Calculated Risk on 4/19/2019 11:31:00 AM
Earlier: Housing Starts Decreased to 1.139 Million Annual Rate in March
Total housing starts in March were below expectations, however starts for January and February, combined, were revised up slightly.
The housing starts report released this morning showed starts were down 0.3% in March compared to February, and starts were down 14.2% year-over-year compared to March 2018.
Single family starts were down 11.0% year-over-year, and multi-family starts were down 21.8%.
This first graph shows the month to month comparison for total starts between 2018 (blue) and 2019 (red).
 Click on graph for larger image.
Starts were down 14.1% in March compared to March 2018.
The year-over-year weakness in March was in both the single family and multi-family sectors.
Last year, in 2018, starts were strong early in the year, and then fell off in the 2nd half - so the early comparisons this year are the most difficult.
My guess is starts will be down slightly year-over-year in 2019 compared to 2018, but nothing like the YoY decline we've seen in February and March.
Below is an update to the graph comparing multi-family starts and completions. Since it usually takes over a year on average to complete a multi-family project, there is a lag between multi-family starts and completions. Completions are important because that is new supply added to the market, and starts are important because that is future new supply (units under construction is also important for employment).
These graphs use a 12 month rolling total for NSA starts and completions.
 The blue line is for multifamily starts and the red line is for multifamily completions.
The rolling 12 month total for starts (blue line) increased steadily for several years following the great recession - but turned down, and has moved sideways recently. Completions (red line) had lagged behind - however completions and starts are at about the same level now.
As I've been noting for a few years, the significant growth in multi-family starts is behind us - multi-family starts peaked in June 2015 (at 510 thousand SAAR).
 The second graph shows single family starts and completions. It usually only takes about 6 months between starting a single family home and completion - so the lines are much closer. The blue line is for single family starts and the red line is for single family completions.
Note the relatively low level of single family starts and completions. The "wide bottom" was what I was forecasting following the recession, and now I expect some further increases in single family starts and completions.
BLS: Unemployment Rates at New Series Lows in North Dakota, Kentucky, Pennsylvania and Vermont
by Calculated Risk on 4/19/2019 10:11:00 AM
From the BLS: Regional and State Employment and Unemployment Summary
Unemployment rates were lower in March in 6 states, higher in 3 states, and stable in 41 states and the District of Columbia, the U.S. Bureau of Labor Statistics reported today.
...
North Dakota and Vermont had the lowest unemployment rates in March, 2.3 percent each. The rates in these two states, as well as those in Kentucky (4.0 percent) and Pennsylvania (3.9 percent), set new series lows. (All state series begin in 1976.) Alaska had the highest jobless rate, 6.5 percent.
emphasis added
 Click on graph for larger image.
This graph shows the number of states (and D.C.) with unemployment rates at or above certain levels since January 1976.
At the worst of the great recession, there were 11 states with an unemployment rate at or above 11% (red).
Currently only one state, Alaska, has an unemployment rate at or above 6% (dark blue). Note that the series low for Alaska is above 6%. Four states and the D.C. have unemployment rates above 5%; Alaska, Arizona, New Mexico and West Virginia.
A total of nine states are at the series low.
Housing Starts Decreased to 1.139 Million Annual Rate in March
by Calculated Risk on 4/19/2019 08:42:00 AM
From the Census Bureau: Permits, Starts and Completions
Housing Starts:
Privately‐owned housing starts in March were at a seasonally adjusted annual rate of 1,139,000. This is 0.3 percent below the revised February estimate of 1,142,000 and is 14.2 percent below the March 2018 rate of 1,327,000. Single‐family housing starts in March were at a rate of 785,000; this is 0.4 percent below the revised February figure of 788,000. The March rate for units in buildings with five units or more was 337,000.
Building Permits:
Privately‐owned housing units authorized by building permits in March were at a seasonally adjusted annual rate of 1,269,000. This is 1.7 percent below the revised February rate of 1,291,000 and is 7.8 percent below the March 2018 rate of 1,377,000. Single‐family authorizations in March were at a rate of 808,000; this is 1.1 percent below the revised February figure of 817,000. Authorizations of units in buildings with five units or more were at a rate of 425,000 in March.
emphasis added
 Click on graph for larger image.
The first graph shows single and multi-family housing starts for the last several years.
Multi-family starts (red, 2+ units) were unchanged in March compared to February. Multi-family starts were down 20% year-over-year in March.
Multi-family is volatile month-to-month, and has been mostly moving sideways the last few years.
Single-family starts (blue) decreased in March, and were down 11% year-over-year.
 The second graph shows total and single unit starts since 1968.
 The second graph shows the huge collapse following the housing bubble, and then eventual recovery (but still historically low).
Total housing starts in March were below expectations. Starts for February were revised down, and starts for January were revised up.
I'll have more later …
Thursday, April 18, 2019
Friday: Housing Starts
by Calculated Risk on 4/18/2019 08:30:00 PM
Friday:
• At 8:30 AM ET, Housing Starts for March. The consensus is for 1.230 million SAAR, up from 1.162 million SAAR in February.
• At 10:00 AM: State Employment and Unemployment (Monthly) for March 2019
NMHC: Apartment Market Tightness Index Increased in April
by Calculated Risk on 4/18/2019 01:11:00 PM
The National Multifamily Housing Council (NMHC) released their April report: April NMHC Quarterly Survey Highlights Continued Strength of the Apartment Market
he apartment market showed signs of strengthening in the National Multifamily Housing Council’s Quarterly Survey of Apartment Market Conditions for April 2019. The Market Tightness (52), Equity Financing (53), and Debt Financing (81) indexes were all above the breakeven level (50), while the Sales Volume index (45) improved, but still showed some continued softness on property sales.This index helped me call the bottom for effective rents (and the top for the vacancy rate) early in 2010. And it also helped me call the bottom in vacancy rate more recently.
“Even as overall economic growth slowed somewhat in the last quarter of 2018 and the first quarter of 2019, the apartment market has rallied,” noted NMHC Chief Economist Mark Obrinsky. “Thirty percent of respondents saw stronger rents and occupancy levels, the most since July 2015. Strong demand for apartments across the country continues to underpin the apartment industry’s strong fundamentals.”
…
The Market Tightness Index increased from 46 to 52, indicating overall improving conditions for the first time since October of 2015. Nearly one-third (30 percent) of respondents reported tighter market conditions in the three months prior compared to 25 percent who reported looser conditions. Almost half (45 percent) of respondents felt that conditions were no different from last quarter.

Click on graph for larger image.
This graph shows the quarterly Apartment Tightness Index. Any reading above 50 indicates tighter conditions from the previous quarter. This indicates market conditions were tighter over the last quarter.
This reading followed thirteen consecutive quarterly surveys indicating looser conditions.
Philly Fed Mfg "Continued to Grow" in April
by Calculated Risk on 4/18/2019 10:28:00 AM
From the Philly Fed: April 2019 Manufacturing Business Outlook Survey
Regional manufacturing activity continued to grow in April, according to results from this month’s Manufacturing Business Outlook Survey. Although the survey’s indicators for general activity and shipments fell from their readings last month, the indicators for new orders, employment, and the workweek improved. The survey’s indexes for future activity and employment continued to moderate, but the surveyed firms remained generally optimistic about growth over the next six months.Here is a graph comparing the regional Fed surveys and the ISM manufacturing index:
The index for current manufacturing activity in the region decreased from a reading of 13.7 in March to 8.5 this month.
...
The firms continued to add to their payrolls this month. The current employment index increased from a reading of 9.6 in March to 14.7 this month.
emphasis added
 Click on graph for larger image.
The New York and Philly Fed surveys are averaged together (yellow, through April), and five Fed surveys are averaged (blue, through March) including New York, Philly, Richmond, Dallas and Kansas City. The Institute for Supply Management (ISM) PMI (red) is through March (right axis).
These early reports suggest the ISM manufacturing index will show expansion again in April, and probably at about the same pace as in March.
Retail Sales increased 1.6% in March
by Calculated Risk on 4/18/2019 08:48:00 AM
On a monthly basis, retail sales decreased 0.2 percent from February to March (seasonally adjusted), and sales were up 3.6 percent from March 2018.
From the Census Bureau report:
Advance estimates of U.S. retail and food services sales for March 2019, adjusted for seasonal variation and holiday and trading-day differences, but not for price changes, were $514.1 billion, an increase of 1.6 percent from the previous month, and 3.6 percent above March 2018. … The January 2019 to February 2019 percent change was unrevised from down 0.2 percent.
 Click on graph for larger image.
This graph shows retail sales since 1992. This is monthly retail sales and food service, seasonally adjusted (total and ex-gasoline).
Retail sales ex-gasoline were up 1.4% in March.
The second graph shows the year-over-year change in retail sales and food service (ex-gasoline) since 1993.
 Retail and Food service sales, ex-gasoline, increased by 3.65% on a YoY basis.
The increase in March was well above expectations, and sales in January and February were revised up, combined. A solid report following the recent weakness in retail sales.
Weekly Initial Unemployment Claims decreased to 192,000
by Calculated Risk on 4/18/2019 08:37:00 AM
The DOL reported:
In the week ending April 13, the advance figure for seasonally adjusted initial claims was 192,000, a decrease of 5,000 from the previous week's revised level. This is the lowest level for initial claims since September 6, 1969 when it was 182,000. The previous week's level was revised up by 1,000 from 196,000 to 197,000. The 4-week moving average was 201,250, a decrease of 6,000 from the previous week's revised average. This is the lowest level for this average since November 1, 1969 when it was 200,500. The previous week's average was revised up by 250 from 207,000 to 207,250The previous week was revised up.
emphasis added
The following graph shows the 4-week moving average of weekly claims since 1971.
 Click on graph for larger image.
The dashed line on the graph is the current 4-week average. The four-week average of weekly unemployment claims decreased to 201,250.
This was below the consensus forecast.


