by Calculated Risk on 2/15/2019 11:58:00 AM
Friday, February 15, 2019
Q4 GDP Forecasts: High-1s, Low-2s, 2018 Annual GDP around 2.8%
The BEA has announced that the Q4 advanced GDP report will be combined with the 2nd estimate of GDP, and will be released on Feb 28th.
From Merrill Lynch:
Weak retail sales data and inventory build caused a 0.8pp decline in our 4Q GDP tracking estimate to 1.5% from 2.3% [Feb 14 estimate]From Goldman Sachs:
emphasis added
The retail sales report indicated a considerably weaker pace of fourth quarter consumption growth than we had previously assumed. Reflecting this and lower-than-expected November business inventories, we lowered our Q4 GDP tracking estimate by five tenths to +2.0% (qoq ar). [Feb 14 estimate]From the NY Fed Nowcasting Report
The New York Fed Staff Nowcast stands at 2.2% for 2018:Q4 and 1.1% for 2019:Q1. [Feb 15 estimate]And from the Altanta Fed: GDPNow
The GDPNow model estimate for real GDP growth (seasonally adjusted annual rate) in the fourth quarter of 2018 is 1.5 percent on February 14, down from 2.7 percent on February 6. [Feb 14 estimate]CR Note: These estimates suggest GDP in the high 1s for Q4.
Using the middle of these four forecasts (about 1.8% real GDP growth in Q4), that would put 2018 annual GDP growth at around 2.8%. This would be the best year since 2015, but lower than many forecasts.
MBA: "Mortgage Delinquencies Dropped to 18-Year Low in the Fourth Quarter of 2018"
by Calculated Risk on 2/15/2019 10:44:00 AM
From the MBA: Mortgage Delinquencies Dropped to 18-Year Low in the Fourth Quarter of 2018
The delinquency rate for mortgage loans on one-to-four-unit residential properties decreased to a seasonally adjusted rate of 4.06 percent of all loans outstanding at the end of the fourth quarter of 2018, according to the Mortgage Bankers Association’s (MBA) National Delinquency Survey.
The delinquency rate was down 41 basis points from the third quarter of 2018 and 111 basis points from one year ago. The percentage of loans on which foreclosure actions were started in the fourth quarter rose by two basis points to 0.25 percent.
“The overall national mortgage delinquency rate in the fourth quarter was at its lowest level since the first quarter of 2000,” said Marina Walsh, MBA’s Vice President of Industry Analysis. “What’s even more noteworthy, the delinquency rate dropped from the previous quarter and on a year-over-year basis across all loan types and stages of delinquency."
Added Walsh, “With the unemployment rate near a 50-year low, wage growth trending higher and household debt levels relative to disposable incomes at a 35-year low, homeowners are in great shape, and mortgage performance is quite strong.”
...
In relation to the third quarter of 2018, mortgage delinquencies decreased across all stages of delinquency. The 30-day delinquency rate decreased 22 basis points to 2.29 percent, the 60-day delinquency rate decreased three basis points to 0.74 percent, and the 90-day delinquency bucket decreased 15 basis points to 1.03 percent.
...
The delinquency rate includes loans that are at least one payment past due, but does not include loans in the process of foreclosure. The percentage of loans in the foreclosure process at the end of the fourth quarter was 0.95 percent, down four basis points from the third quarter of 2018 and 24 basis points lower than one year ago. This was the lowest foreclosure inventory rate since the first quarter of 1996.
...
The serious delinquency rate, the percentage of loans that are 90 days or more past due or in the process of foreclosure, was 2.06 percent – a decrease of seven basis points from last quarter – and a decrease of 85 basis points from last year.
emphasis added
 Click on graph for larger image.
This graph shows the percent of loans delinquent by days past due.
The percent of loans delinquent decreased in Q4 and is at the lowest rate since Q1 2000.
The percent of loans in the foreclosure process continues to decline, and is now at the lowest level since 1996.
Industrial Production Decreased 0.6% in January
by Calculated Risk on 2/15/2019 09:20:00 AM
From the Fed: Industrial Production and Capacity Utilization
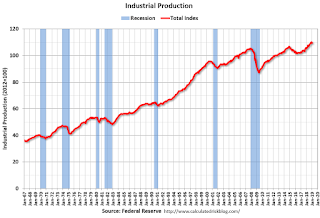
Industrial production decreased 0.6 percent in January after rising 0.1 percent in December. In January, manufacturing production fell 0.9 percent, primarily as a result of a large drop in motor vehicle assemblies; factory output excluding motor vehicles and parts decreased 0.2 percent. The indexes for mining and utilities moved up 0.1 percent and 0.4 percent, respectively. At 109.4 percent of its 2012 average, total industrial production was 3.8 percent higher in January than it was a year earlier. Capacity utilization for the industrial sector decreased 0.6 percentage point in January to 78.2 percent, a rate that is 1.6 percentage points below its long-run (1972–2018) average.
emphasis added
 Click on graph for larger image.
This graph shows Capacity Utilization. This series is up 11.5 percentage points from the record low set in June 2009 (the series starts in 1967).
Capacity utilization at 78.2% is 1.6% below the average from 1972 to 2017 and below the pre-recession level of 80.8% in December 2007.
Note: y-axis doesn't start at zero to better show the change.
 The second graph shows industrial production since 1967.
Industrial production decreased in January to 109.4. This is 25.6% above the recession low, and 3.8% above the pre-recession peak.
The decrease in industrial production and capacity utilization were well below consensus.
NY Fed: Manufacturing "Business activity grew modestly in New York State"
by Calculated Risk on 2/15/2019 08:36:00 AM
From the NY Fed: Empire State Manufacturing Survey
Business activity grew modestly in New York State, according to firms responding to the February 2019 Empire State Manufacturing Survey. The headline general business conditions index moved up five points to 8.8. New orders and shipments also increased modestly. Delivery times were slightly longer, and inventories held steady. Labor market indicators pointed to a slight increase in employment and hours worked. The prices paid index moved lower for a third consecutive month, indicating an ongoing deceleration in input price increases, while the prices received index climbed ten points to reach its highest level in several months, indicating a pickup in selling price increases. After slumping last month, indexes assessing the six-month outlook improved noticeably, suggesting firms were fairly optimistic about future conditions.This was close to the consensus forecast.
The index for number of employees fell for a second consecutive month, declining three points to a still-positive 4.1, pointing to a slight increase in employment levels, and the average workweek index moved down to 2.5. emphasis added
Thursday, February 14, 2019
Friday: Industrial Production, NY Fed Mfg Survey
by Calculated Risk on 2/14/2019 07:36:00 PM
Friday:
• At 8:30 AM: The New York Fed Empire State manufacturing survey for February. The consensus is for a reading of 7.0, up from 3.9.
• At 9:15 AM: The Fed will release Industrial Production and Capacity Utilization for January. The consensus is for a 0.2% increase in Industrial Production, and for Capacity Utilization to increase to 78.8%.
• At 10:00 AM: University of Michigan's Consumer sentiment index (Preliminary for February). The consensus is for a reading of 92.5.
Q4 GDP Estimates Revised Down Sharply
by Calculated Risk on 2/14/2019 02:59:00 PM
Following the weak retail sales report, Q4 GDP estimates have been revised down.
From Goldman Sachs:
The retail sales report indicated a considerably weaker pace of fourth quarter consumption growth than we had previously assumed. Reflecting this and lower-than-expected November business inventories, we lowered our Q4 GDP tracking estimate by five tenths to +2.0% (qoq ar).From Merrill Lynch:
Weak retail sales data and inventory build caused a 0.8pp decline in our 4Q GDP tracking estimate to 1.5% from 2.3%
LA area Port Traffic in January; Imports Up YoY, Exports Down
by Calculated Risk on 2/14/2019 11:39:00 AM
Container traffic gives us an idea about the volume of goods being exported and imported - and usually some hints about the trade report since LA area ports handle about 40% of the nation's container port traffic.
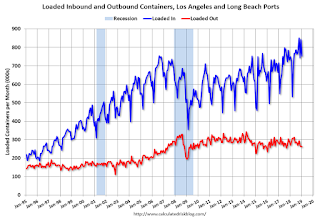
The following graphs are for inbound and outbound traffic at the ports of Los Angeles and Long Beach in TEUs (TEUs: 20-foot equivalent units or 20-foot-long cargo container).
To remove the strong seasonal component for inbound traffic, the first graph shows the rolling 12 month average.

On a rolling 12 month basis, inbound traffic was up 0.1% in January compared to the rolling 12 months ending in December. Outbound traffic was down 0.2% compared to the rolling 12 months ending the previous month.
The 2nd graph is the monthly data (with a strong seasonal pattern for imports).

In general imports have been increasing, and exports have mostly moved sideways over the last 8 years.
Retail Sales decreased 1.2% in December
by Calculated Risk on 2/14/2019 09:37:00 AM
Note: This release is for December (not January). The Census Bureau is working to catch up following the government shutdown.
On a monthly basis, retail sales decreased 1.2 percent from November to December (seasonally adjusted), and sales were up 2.3 percent from December 2017.
From the Census Bureau report:
Advance estimates of U.S. retail and food services sales for December 2018, adjusted for seasonal variation and holiday and trading-day differences, but not for price changes, were $505.8 billion, a decrease of 1.2 percent from the previous month, but 2.3 percent above December 2017.
 Click on graph for larger image.
This graph shows retail sales since 1992. This is monthly retail sales and food service, seasonally adjusted (total and ex-gasoline).
Retail sales ex-gasoline were down 0.9% in December.
The second graph shows the year-over-year change in retail sales and food service (ex-gasoline) since 1993.
 Retail and Food service sales, ex-gasoline, increased by 2.9% on a YoY basis.
The decrease in December was below expectations; sales in October and November were revised down significantly.
Weekly Initial Unemployment Claims increased to 239,000
by Calculated Risk on 2/14/2019 09:24:00 AM
The DOL reported:
In the week ending February 9, the advance figure for seasonally adjusted initial claims was 239,000, an increase of 4,000 from the previous week's revised level. The previous week's level was revised up by 1,000 from 234,000 to 235,000. The 4-week moving average was 231,750, an increase of 6,750 from the previous week's revised average. This is the highest level for this average since January 27, 2018 when it was 234,000. The previous week's average was revised up by 250 from 224,750 to 225,000.The previous week was revised up.
emphasis added
The following graph shows the 4-week moving average of weekly claims since 1971.
 Click on graph for larger image.
The dashed line on the graph is the current 4-week average. The four-week average of weekly unemployment claims increased to 231,750.
This was higher than the consensus forecast.
Wednesday, February 13, 2019
Thursday: Unemployment Claims, Retail Sales, PPI
by Calculated Risk on 2/13/2019 06:44:00 PM
Thursday:
• At 8:30 AM ET, The initial weekly unemployment claims report will be released. The consensus is for 225 thousand initial claims, down from 234 thousand the previous week.
• Also at 8:30 AM, The Producer Price Index for January from the BLS. The consensus is for a 0.2% increase in PPI, and a 0.2% increase in core PPI.
• Also at 8:30 AM: Retail sales for December is scheduled to be released. The consensus is for a 0.1% increase in retail sales.


