by Calculated Risk on 2/01/2019 06:36:00 PM
Friday, February 01, 2019
Oil: Another large drop in rig counts
A few comments from Steven Kopits of Princeton Energy Advisors LLC on February 1, 2019:
• Oil rig counts imploded, -15 to 847
• The news on the horizontal oil rig count was not as bad, -7 to 759
• The Permian lost 2, ‘Other US’ was whacked with -7, but all other named plays were flat
• We now have enough data to begin to sketch out this mini-cycle (assuming the historical relationship of rigs to oil prices holds)
• Having fallen by 27 in the last four weeks, the model suggests the horizontal oil rig count will fall by additional 65 or so rigs before bottoming in April. So pencil in 100 total horizontal oil rigs lost in Q1.
• Assuming oil prices crawl back up to $60 WTI – and both the futures curve and recent oil prices trends suggest that is possible – rig counts should stabilize or begin to recover in Q2.
 Click on graph for larger image.
CR note: This graph shows the US horizontal rig count by basin.
Graph and comments Courtesy of Steven Kopits of Princeton Energy Advisors LLC.
Q4 GDP Forecasts: Mid 2s
by Calculated Risk on 2/01/2019 02:02:00 PM
The BEA has not yet announced a new release date for the Q4 advanced GDP report.
From Merrill Lynch:
data cut 0.5pp from 4Q GDP tracking, bringing us down to 2.3% qoq saar. [Feb 1 estimate]From Goldman Sachs:
emphasis added
we left our Q4 GDP tracking estimate unchanged at +2.5% (qoq ar). [Feb 1 estimate]From the NY Fed Nowcasting Report
The GDP release scheduled for this week was postponed as a result of the partial shutdown of the federal government. The New York Fed Staff Nowcast stands at 2.6% for 2018:Q4 and 2.4% for 2019:Q1. [Feb 1 estimate]And from the Altanta Fed: GDPNow
The GDPNow model estimate for real GDP growth (seasonally adjusted annual rate) in the fourth quarter of 2018 is 2.5 percent on February 1, down from 2.7 percent on January 31. [Feb 1 estimate]CR Note: These estimates suggest GDP in the mid 2s for Q4.
Comments on January Employment Report
by Calculated Risk on 2/01/2019 12:04:00 PM
The headline jobs number at 304 thousand for January was well above consensus expectations of 158 thousand, however the previous two months were revised down 70 thousand, combined. The unemployment rate increased to 4.0%, due to government employees on furlough being counted as unemployed in the household survey (but jobs counted in the establishment survey). Overall this was a strong report.
Earlier: January Employment Report: 304,000 Jobs Added, 4.0% Unemployment Rate
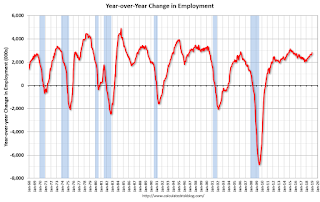
In January, the year-over-year employment change was 2.807 million jobs. That is solid year-over-year growth.
Average Hourly Earnings
Wage growth was at expectations in January. From the BLS:
"In January, average hourly earnings for all employees on private nonfarm payrolls rose by 3 cents to $27.56, following a 10-cent gain in December. Over the year, average hourly earnings have increased by 85 cents, or 3.2 percent."
 This graph is based on “Average Hourly Earnings” from the Current Employment Statistics (CES) (aka "Establishment") monthly employment report. Note: There are also two quarterly sources for earnings data: 1) “Hourly Compensation,” from the BLS’s Productivity and Costs; and 2) the Employment Cost Index which includes wage/salary and benefit compensation.
The graph shows the nominal year-over-year change in "Average Hourly Earnings" for all private employees. Nominal wage growth was at 3.2% YoY in January.
Wage growth has generally been trending up.
Prime (25 to 54 Years Old) Participation
 Since the overall participation rate has declined due to cyclical (recession) and demographic (aging population, younger people staying in school) reasons, here is the employment-population ratio for the key working age group: 25 to 54 years old.
In the earlier period the participation rate for this group was trending up as women joined the labor force. Since the early '90s, the participation rate moved more sideways, with a downward drift starting around '00 - and with ups and downs related to the business cycle.
The 25 to 54 participation rate increased in December to 82.6%, and the 25 to 54 employment population ratio was unchanged at 79.9%.
Part Time for Economic Reasons
 From the BLS report:
"The number of persons employed part time for economic reasons (sometimes referred to as involuntary part-time workers) increased by about one-half million to 5.1 million in January. Nearly all of this increase occurred in the private sector and may reflect the impact of the partial federal government shutdown."The number of persons working part time for economic reasons has been generally trending down. The number increased sharply in January, probably as a result of the government shutdown. The number working part time for economic reasons suggests there is still a little slack in the labor market.
These workers are included in the alternate measure of labor underutilization (U-6) that increased sharply to 8.1% in January.
Unemployed over 26 Weeks
 This graph shows the number of workers unemployed for 27 weeks or more.
 According to the BLS, there are 1.252 million workers who have been unemployed for more than 26 weeks and still want a job. This was down from 1.306 million in January.
Summary:
The headline jobs number was well above expectations, however the previous two months were revised down. The headline unemployment rate increased to 4.0% due to the government shutdown.
Some of the quirky aspects of the employment report were due to the government shutdown (rise in the unemployment rate, sharp rise in "Part Time for Economic Reasons" workers, and the sharp rise in U-6.) My guess is most of the rise in Part Time was related to private sector workers getting fewer hours due to the shutdown, however some of the increase might be related to government workers taking part time jobs to pay the bills (as a reminder, the establishment report is for jobs - and government employees on furlough taking part time jobs would be counted as having two jobs).
Overall, this was a strong report.
Construction Spending increased in November
by Calculated Risk on 2/01/2019 11:25:00 AM
Note: This is for November. The release of the December report has not been scheduled yet.
From the Census Bureau reported that overall construction spending increased in November:
Construction spending during November 2018 was estimated at a seasonally adjusted annual rate of $1,299.9 billion, 0.8 percent above the revised October estimate of $1,289.7 billion. The November figure is 3.4 percent above the November 2017 estimate of $1,257.3 billion.Private spending increased and public spending decreased:
Spending on private construction was at a seasonally adjusted annual rate of $993.4 billion, 1.3 percent above the revised October estimate of $980.4 billion. ...
In November, the estimated seasonally adjusted annual rate of public construction spending was $306.5 billion, 0.9 percent below the revised October estimate of $309.3 billion.
emphasis added
 Click on graph for larger image.
This graph shows private residential and nonresidential construction spending, and public spending, since 1993. Note: nominal dollars, not inflation adjusted.
Private residential spending had been increasing - although has declined recently - and is still 20% below the bubble peak.
Non-residential spending is 9% above the previous peak in January 2008 (nominal dollars).
Public construction spending is now 6% below the peak in March 2009, and 17% above the austerity low in February 2014.
 The second graph shows the year-over-year change in construction spending.
On a year-over-year basis, private residential construction spending is up 1%. Non-residential spending is up 4% year-over-year. Public spending is up 7% year-over-year.
This was above consensus expectations, however spending for September and October were revised down.
ISM Manufacturing index Increased to 56.6 in January
by Calculated Risk on 2/01/2019 10:13:00 AM
The ISM manufacturing index indicated expansion in December. The PMI was at 56.6% in January, up from 54.3% in December. The employment index was at 55.5%, down from 56.0% last month, and the new orders index was at 58.2%, up from 51.3%.
From the Institute for Supply Management: January 2019 Manufacturing ISM® Report On Business®
Economic activity in the manufacturing sector expanded in January, and the overall economy grew for the 117th consecutive month, say the nation’s supply executives in the latest Manufacturing ISM® Report On Business®.
The report was issued today by Timothy R. Fiore, CPSM, C.P.M., Chair of the Institute for Supply Management® (ISM®) Manufacturing Business Survey Committee: “The January PMI® registered 56.6 percent, an increase of 2.3 percentage points from the December reading of 54.3 percent. The New Orders Index registered 58.2 percent, an increase of 6.9 percentage points from the December reading of 51.3 percent. The Production Index registered 60.5 percent, 6.4-percentage point increase compared to the December reading of 54.1 percent. The Employment Index registered 55.5 percent, a decrease of 0.5 percentage point from the December reading of 56 percent. The Supplier Deliveries Index registered 56.2 percent, a 2.8 percentage point decrease from the December reading of 59 percent. The Inventories Index registered 52.8 percent, an increase of 1.6 percentage points from the December reading of 51.2 percent. The Prices Index registered 49.6 percent, a 5.3-percentage point decrease from the December reading of 54.9 percent, indicating lower raw materials prices for the first time in nearly three years.
emphasis added
 Click on graph for larger image.
Here is a long term graph of the ISM manufacturing index.
This was above expectations of 54.0%, and suggests manufacturing expanded at a faster pace in January than in December.
January Employment Report: 304,000 Jobs Added, 4.0% Unemployment Rate (Graphs added)
by Calculated Risk on 2/01/2019 09:21:00 AM
From the BLS:
Total nonfarm payroll employment increased by 304,000 in January, and the unemployment rate edged up to 4.0 percent, the U.S. Bureau of Labor Statistics reported today. Job gains occurred in several industries, including leisure and hospitality, construction, health care, and transportation and warehousing.
...
Both the unemployment rate, at 4.0 percent, and the number of unemployed persons, at 6.5 million, edged up in January. The impact of the partial federal government shutdown contributed to the uptick in these measures. Among the unemployed, the number who reported being on temporary layoff increased by 175,000. This figure includes furloughed federal employees who were classified as unemployed on temporary layoff under the definitions used in the household survey.
...
The change in total nonfarm payroll employment for November was revised up from +176,000 to +196,000, and the change for December was revised down from +312,000 to +222,000. With these revisions, employment gains in November and December combined were 70,000 less than previously reported.
...
In January, average hourly earnings for all employees on private nonfarm payrolls rose by 3 cents to $27.56, following a 10-cent gain in December. Over the year, average hourly earnings have increased by 85 cents, or 3.2 percent.
…
[Annual Revision] In accordance with annual practice, the establishment survey data released today have been benchmarked to reflect comprehensive counts of payroll jobs for March 2018. These counts are derived principally from the Quarterly Census of Employment and Wages (QCEW), which counts jobs covered by the Unemployment Insurance (UI) tax system. ... The total nonfarm employment level for March 2018 was revised downward by 1,000 (-16,000 on a not seasonally adjusted basis, or less than -0.05 percent).
emphasis added
 Click on graph for larger image.
The first graph shows the monthly change in payroll jobs, ex-Census (meaning the impact of the decennial Census temporary hires and layoffs is removed - mostly in 2010 - to show the underlying payroll changes).
Total payrolls increased by 304 thousand in January (private payrolls increased 296 thousand).
Payrolls for November and December were revised down 70 thousand combined.
 This graph shows the year-over-year change in total non-farm employment since 1968.
In January the year-over-year change was 2.807 million jobs.
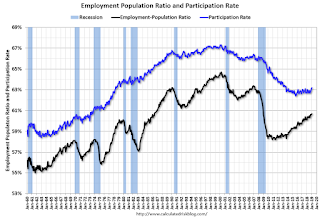
The third graph shows the employment population ratio and the participation rate.
 The Labor Force Participation Rate increased in January to 63.2%. This is the percentage of the working age population in the labor force. A large portion of the recent decline in the participation rate is due to demographics and long term trends.
The Employment-Population ratio was increased to 60.7% (black line).
I'll post the 25 to 54 age group employment-population ratio graph later.
 The fourth graph shows the unemployment rate.
 The unemployment rate increased in January to 4.0%.
This was well above the consensus expectations of 158,000 jobs added, however November and December were down by 70,000 combined. A strong report.
I'll have much more later ...
January Employment Report: 304,000 Jobs Added, 4.0% Unemployment Rate
by Calculated Risk on 2/01/2019 08:34:00 AM
From the BLS:
Total nonfarm payroll employment increased by 304,000 in January, and the unemployment rate edged up to 4.0 percent, the U.S. Bureau of Labor Statistics reported today. Job gains occurred in several industries, including leisure and hospitality, construction, health care, and transportation and warehousing.I'll have much more later ...
...
Both the unemployment rate, at 4.0 percent, and the number of unemployed persons, at 6.5 million, edged up in January. The impact of the partial federal government shutdown contributed to the uptick in these measures. Among the unemployed, the number who reported being on temporary layoff increased by 175,000. This figure includes furloughed federal employees who were classified as unemployed on temporary layoff under the definitions used in the household survey.
...
The change in total nonfarm payroll employment for November was revised up from +176,000 to +196,000, and the change for December was revised down from +312,000 to +222,000. With these revisions, employment gains in November and December combined were 70,000 less than previously reported.
...
In January, average hourly earnings for all employees on private nonfarm payrolls rose by 3 cents to $27.56, following a 10-cent gain in December. Over the year, average hourly earnings have increased by 85 cents, or 3.2 percent.
emphasis added
Thursday, January 31, 2019
Friday: Employment Report, ISM Manufacturing, Construction Spending, Auto Sales
by Calculated Risk on 1/31/2019 09:17:00 PM
My January Employment Preview
Goldman: January Payrolls Preview
Friday:
• At 8:30 AM ET, Employment Report for January. The consensus is for 158,000 jobs added, and for the unemployment rate to be unchanged at 3.9%.
• At 10:00 AM, ISM Manufacturing Index for January. The consensus is for the ISM to be at 54.0, down from 54.1 in December.
• At 10:00 AM, Construction Spending for November. The consensus is for a 0.2% increase in construction spending (The December release hasn't been scheduled).
• All day, Light vehicle sales for January. The consensus is for light vehicle sales to be 17.2 million SAAR in January, unchanged from 17.2 million in December (Seasonally Adjusted Annual Rate).
Fannie Mae: Mortgage Serious Delinquency Rate unchanged in December
by Calculated Risk on 1/31/2019 04:11:00 PM
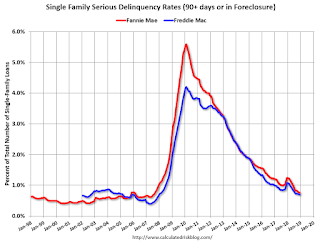
Fannie Mae reported that the Single-Family Serious Delinquency rate was unchanged at 0.76% in December, from 0.76% in November. The serious delinquency rate is down from 1.24% in December 2017.
These are mortgage loans that are "three monthly payments or more past due or in foreclosure".
The Fannie Mae serious delinquency rate peaked in February 2010 at 5.59%.
This matches last month ass the lowest serious delinquency rate for Fannie Mae since August 2007.

By vintage, for loans made in 2004 or earlier (3% of portfolio), 2.69% are seriously delinquent. For loans made in 2005 through 2008 (5% of portfolio), 4.61% are seriously delinquent, For recent loans, originated in 2009 through 2018 (92% of portfolio), only 0.34% are seriously delinquent. So Fannie is still working through poor performing loans from the bubble years.
The increase late last year in the delinquency rate was due to the hurricanes - there were no worries about the overall market.
I expect the serious delinquency rate will probably decline to 0.5 to 0.7 percent or so to a cycle bottom.
Note: Freddie Mac reported earlier.
Goldman: January Payrolls Preview
by Calculated Risk on 1/31/2019 04:06:00 PM
A few brief excerpts from a note by Goldman Sachs economists Choi and Hill:
We estimate nonfarm payrolls increased 180k in January, somewhat above consensus of +165k. … while weather likely contributed to last month’s blockbuster report, January was also relatively warm and dry during the reference week. The BLS has also clarified that furloughed and unpaid government workers will be included in tomorrow’s payroll counts (though contractor layoffs could weigh in some industries).
We estimate the unemployment rate increased one tenth to 4.0% in January (vs. consensus of 3.9%), mostly reflecting the furlough of nearly 400k federal workers that the BLS plans to classify as “unemployed on temporary layoff.” ... Finally, we expect average hourly earnings will increase 0.2% month-over-month and 3.1% year-over-year in tomorrow’s report...
emphasis added


