 RSS Feed
 by Calculated Risk on 1/22/2019 10:12:00 AM
Tuesday, January 22, 2019
NAR: Existing-Home Sales Decreased to 4.99 million in December
From the NAR: Existing-Home Sales See 6.4 Percent Drop in December
After two consecutive months of increases, existing-home sales declined in the month of December, according to the National Association of Realtors®. None of the four major U.S. regions saw a gain in sales activity last month.
Total existing-home sales, completed transactions that include single-family homes, townhomes, condominiums and co-ops, decreased 6.4 percent from November to a seasonally adjusted rate of 4.99 million in December. Sales are now down 10.3 percent from a year ago (5.56 million in December 2017).
...
Total housing inventory at the end of December decreased to 1.55 million, down from 1.74 million existing homes available for sale in November, but represents an increase from 1.46 million a year ago. Unsold inventory is at a 3.7-month supply at the current sales pace, down from 3.9 last month and up from 3.2 months a year ago.
emphasis added
 Click on graph for larger image.
This graph shows existing home sales, on a Seasonally Adjusted Annual Rate (SAAR) basis since 1993.
Sales in December (4.99 million SAAR) were down 6.4% from last month, and were 10.3% below the December 2017 rate.
The second graph shows nationwide inventory for existing homes.
 According to the NAR, inventory decreased to 1.55 million in December from 1.74 million in November. Headline inventory is not seasonally adjusted, and inventory usually decreases to the seasonal lows in December and January, and peaks in mid-to-late summer.
The last graph shows the year-over-year (YoY) change in reported existing home inventory and months-of-supply. Since inventory is not seasonally adjusted, it really helps to look at the YoY change. Note: Months-of-supply is based on the seasonally adjusted sales and not seasonally adjusted inventory.
 Inventory was up 6.2% year-over-year in December compared to December 2017.
 Months of supply was at 3.7 months in December.
For existing home sales, a key number is inventory - and inventory is still low, but appears to have bottomed. I'll have more later ...
Monday, January 21, 2019
Tuesday: Existing Home Sales
by Calculated Risk on 1/21/2019 06:36:00 PM
Weekend:
• Schedule for Week of January 20, 2019
Tuesday:
• At 10:00 AM ET, Existing Home Sales for December from the National Association of Realtors (NAR). The consensus is for 5.24 million SAAR, down from 5.32 million. Housing economist Tom Lawler expects the NAR to report sales of 4.97 million SAAR for December.
From CNBC: Pre-Market Data and Bloomberg futures: S&P 500 are down 10 and DOW futures are down 90 (fair value).
Oil prices were up over the last week with WTI futures at $53.90 per barrel and Brent at $62.84 per barrel. A year ago, WTI was at $64, and Brent was at $69 - so oil prices are down about 15% year-over-year.
Here is a graph from Gasbuddy.com for nationwide gasoline prices. Nationally prices are at $2.24 per gallon. A year ago prices were at $2.52 per gallon, so gasoline prices are down 28 cents per gallon year-over-year.
Existing Home Sales for December: Take the Under
by Calculated Risk on 1/21/2019 08:31:00 AM
The NAR is scheduled to release Existing Home Sales for December at 10:00 AM on Tuesday, January 22nd.
The consensus is for 5.24 million SAAR, down from 5.32 million in November. Housing economist Tom Lawler estimates the NAR will reports sales of 4.97 million SAAR for December and that inventory will be up 5.5% year-over-year. Based on Lawler's estimate, I expect existing home sales to be well below the consensus for December.
Housing economist Tom Lawler has been sending me his predictions of what the NAR will report for almost 9 years. The table below shows the consensus for each month, Lawler's predictions, and the NAR's initially reported level of sales.
Lawler hasn't always been closer than the consensus, but usually when there has been a fairly large spread between Lawler's estimate and the "consensus", Lawler has been closer.
Last month, in November 2018, the consensus was for sales of 5.19 million on a seasonally adjusted annual rate (SAAR) basis. Lawler estimated the NAR would report 5.23 million, and the NAR reported 5.32 million (as usual Lawler was closer than the consensus).
NOTE: There have been times when Lawler "missed", but then he pointed out an apparent error in the NAR data - and the subsequent revision corrected that error. As an example, see: The “Curious Case” of Existing Home Sales in the South in April
Over the last eight plus years, the consensus average miss was 143 thousand, and Lawler's average miss was 67 thousand.
| Existing Home Sales, Forecasts and NAR Report millions, seasonally adjusted annual rate basis (SAAR) | |||
|---|---|---|---|
| Month | Consensus | Lawler | NAR reported1 |
| May-10 | 6.20 | 5.83 | 5.66 |
| Jun-10 | 5.30 | 5.30 | 5.37 |
| Jul-10 | 4.66 | 3.95 | 3.83 |
| Aug-10 | 4.10 | 4.10 | 4.13 |
| Sep-10 | 4.30 | 4.50 | 4.53 |
| Oct-10 | 4.50 | 4.46 | 4.43 |
| Nov-10 | 4.85 | 4.61 | 4.68 |
| Dec-10 | 4.90 | 5.13 | 5.28 |
| Jan-11 | 5.20 | 5.17 | 5.36 |
| Feb-11 | 5.15 | 5.00 | 4.88 |
| Mar-11 | 5.00 | 5.08 | 5.10 |
| Apr-11 | 5.20 | 5.15 | 5.05 |
| May-11 | 4.75 | 4.80 | 4.81 |
| Jun-11 | 4.90 | 4.71 | 4.77 |
| Jul-11 | 4.92 | 4.69 | 4.67 |
| Aug-11 | 4.75 | 4.92 | 5.03 |
| Sep-11 | 4.93 | 4.83 | 4.91 |
| Oct-11 | 4.80 | 4.86 | 4.97 |
| Nov-11 | 5.08 | 4.40 | 4.42 |
| Dec-11 | 4.60 | 4.64 | 4.61 |
| Jan-12 | 4.69 | 4.66 | 4.57 |
| Feb-12 | 4.61 | 4.63 | 4.59 |
| Mar-12 | 4.62 | 4.59 | 4.48 |
| Apr-12 | 4.66 | 4.53 | 4.62 |
| May-12 | 4.57 | 4.66 | 4.55 |
| Jun-12 | 4.65 | 4.56 | 4.37 |
| Jul-12 | 4.50 | 4.47 | 4.47 |
| Aug-12 | 4.55 | 4.87 | 4.82 |
| Sep-12 | 4.75 | 4.70 | 4.75 |
| Oct-12 | 4.74 | 4.84 | 4.79 |
| Nov-12 | 4.90 | 5.10 | 5.04 |
| Dec-12 | 5.10 | 4.97 | 4.94 |
| Jan-13 | 4.90 | 4.94 | 4.92 |
| Feb-13 | 5.01 | 4.87 | 4.98 |
| Mar-13 | 5.03 | 4.89 | 4.92 |
| Apr-13 | 4.92 | 5.03 | 4.97 |
| May-13 | 5.00 | 5.20 | 5.18 |
| Jun-13 | 5.27 | 4.99 | 5.08 |
| Jul-13 | 5.13 | 5.33 | 5.39 |
| Aug-13 | 5.25 | 5.35 | 5.48 |
| Sep-13 | 5.30 | 5.26 | 5.29 |
| Oct-13 | 5.13 | 5.08 | 5.12 |
| Nov-13 | 5.02 | 4.98 | 4.90 |
| Dec-13 | 4.90 | 4.96 | 4.87 |
| Jan-14 | 4.70 | 4.67 | 4.62 |
| Feb-14 | 4.64 | 4.60 | 4.60 |
| Mar-14 | 4.56 | 4.64 | 4.59 |
| Apr-14 | 4.67 | 4.70 | 4.65 |
| May-14 | 4.75 | 4.81 | 4.89 |
| Jun-14 | 4.99 | 4.96 | 5.04 |
| Jul-14 | 5.00 | 5.09 | 5.15 |
| Aug-14 | 5.18 | 5.12 | 5.05 |
| Sep-14 | 5.09 | 5.14 | 5.17 |
| Oct-14 | 5.15 | 5.28 | 5.26 |
| Nov-14 | 5.20 | 4.90 | 4.93 |
| Dec-14 | 5.05 | 5.15 | 5.04 |
| Jan-15 | 5.00 | 4.90 | 4.82 |
| Feb-15 | 4.94 | 4.87 | 4.88 |
| Mar-15 | 5.04 | 5.18 | 5.19 |
| Apr-15 | 5.22 | 5.20 | 5.04 |
| May-15 | 5.25 | 5.29 | 5.35 |
| Jun-15 | 5.40 | 5.45 | 5.49 |
| Jul-15 | 5.41 | 5.64 | 5.59 |
| Aug-15 | 5.50 | 5.54 | 5.31 |
| Sep-15 | 5.35 | 5.56 | 5.55 |
| Oct-15 | 5.41 | 5.33 | 5.36 |
| Nov-15 | 5.32 | 4.97 | 4.76 |
| Dec-15 | 5.19 | 5.36 | 5.46 |
| Jan-16 | 5.32 | 5.36 | 5.47 |
| Feb-16 | 5.30 | 5.20 | 5.08 |
| Mar-16 | 5.27 | 5.27 | 5.33 |
| Apr-16 | 5.40 | 5.44 | 5.45 |
| May-16 | 5.64 | 5.55 | 5.53 |
| Jun-16 | 5.48 | 5.62 | 5.57 |
| Jul-16 | 5.52 | 5.41 | 5.39 |
| Aug-16 | 5.44 | 5.49 | 5.33 |
| Sep-16 | 5.35 | 5.55 | 5.47 |
| Oct-16 | 5.44 | 5.47 | 5.60 |
| Nov-16 | 5.54 | 5.60 | 5.61 |
| Dec-16 | 5.54 | 5.55 | 5.49 |
| Jan-17 | 5.55 | 5.60 | 5.69 |
| Feb-17 | 5.55 | 5.41 | 5.48 |
| Mar-17 | 5.61 | 5.74 | 5.71 |
| Apr-17 | 5.67 | 5.56 | 5.57 |
| May-17 | 5.55 | 5.65 | 5.62 |
| Jun-17 | 5.58 | 5.59 | 5.52 |
| Jul-17 | 5.57 | 5.38 | 5.44 |
| Aug-17 | 5.48 | 5.39 | 5.35 |
| Sep-17 | 5.30 | 5.38 | 5.39 |
| Oct-17 | 5.30 | 5.60 | 5.48 |
| Nov-17 | 5.52 | 5.77 | 5.81 |
| Dec-17 | 5.75 | 5.66 | 5.57 |
| Jan-18 | 5.65 | 5.48 | 5.38 |
| Feb-18 | 5.42 | 5.44 | 5.54 |
| Mar-18 | 5.28 | 5.51 | 5.60 |
| Apr-18 | 5.60 | 5.48 | 5.46 |
| May-18 | 5.56 | 5.47 | 5.43 |
| Jun-18 | 5.45 | 5.35 | 5.38 |
| Jul-18 | 5.43 | 5.40 | 5.34 |
| Aug-18 | 5.36 | 5.36 | 5.34 |
| Sep-18 | 5.30 | 5.20 | 5.15 |
| Oct-18 | 5.20 | 5.31 | 5.22 |
| Nov-18 | 5.19 | 5.23 | 5.32 |
| Dec-18 | 5.24 | 4.97 | --- |
| 1NAR initially reported before revisions. | |||
Sunday, January 20, 2019
Oil: A huge drop in rig counts
by Calculated Risk on 1/20/2019 10:43:00 AM
A few comments from Steven Kopits of Princeton Energy Advisors LLC on January 18, 2019:
• A huge drop in oil rig counts, -21 to 852
• Horizontal oil rig count collapsed, -17 to 765
• The Permian lost 10 horizontal oil rigs, ‘Other US’ lost 16
• Curiously, the Williston (+2), the Eagle Ford (+2) and the Cana Woodford (+5) all gained horizontal oil rigs
• Breakeven to add rigs fell rose to $61 WTI compared to $52.60 WTI on the screen as of the writing of this report.
• The model continues to predict big rig roll-offs in the next several weeks.
 Click on graph for larger image.
CR note: This graph shows the US horizontal rig count by basin.
Graph and comments Courtesy of Steven Kopits of Princeton Energy Advisors LLC.
Saturday, January 19, 2019
Schedule for Week of January 20th
by Calculated Risk on 1/19/2019 08:11:00 AM
Special Note on Government Shutdown: If the Government shutdown continues, then some additional releases will be delayed. For example, this coming week, the new home sales and durable goods reports will not be released if the government remains shutdown - and probably delayed even if the government opens. (see bottom for key releases already delayed).
The key reports scheduled for this week are December New and Existing Home sales.
For manufacturing, the January Richmond and Kansas City Fed manufacturing surveys will be released.
All US markets will be closed in observance of Martin Luther King Jr. Day
 10:00 AM: Existing Home Sales for December from the National Association of Realtors (NAR). The consensus is for 5.24 million SAAR, down from 5.32 million.
The graph shows existing home sales from 1994 through the report last month.
Housing economist Tom Lawler expects the NAR to report sales of 4.97 million SAAR for December.
7:00 AM ET: The Mortgage Bankers Association (MBA) will release the results for the mortgage purchase applications index.
9:00 AM: FHFA House Price Index for November 2018. This was originally a GSE only repeat sales, however there is also an expanded index.
10:00 AM: Richmond Fed Survey of Manufacturing Activity for January.
During the day: The AIA's Architecture Billings Index for December (a leading indicator for commercial real estate).
8:30 AM: The initial weekly unemployment claims report will be released. The consensus is for 217 thousand initial claims, up from 213 thousand the previous week.
11:00 AM: the Kansas City Fed manufacturing survey for December.
8:30 AM: Durable Goods Orders for December from the Census Bureau. The consensus is for a 1.8% increase in durable goods orders.
 10:00 AM: New Home Sales for December from the Census Bureau.
 This graph shows New Home Sales since 1963. The dashed line is the sales rate for October (November was not released).
The consensus is for 565 thousand SAAR.
New Home Sales (Census) for November from the Census Bureau. The consensus was for 560 thousand SAAR, up from 544 thousand in October.
Construction Spending (Census) for November. The consensus was for a 0.3% increase in construction spending.
Light vehicle sales (BEA) for December. The consensus was for light vehicle sales to be 17.2 million SAAR in December, down from 17.4 million in November (Seasonally Adjusted Annual Rate).
Trade Balance report (Census) for November from the Census Bureau. The consensus was the trade deficit would be $53.9 billion. The U.S. trade deficit was at $55.5 billion in October.
Retail sales for December. (Census) The consensus was for a 0.2% increase in retail sales.
Housing Starts for December. (Census) The consensus was for 1.256 million SAAR, unchanged from 1.256 million SAAR.
Friday, January 18, 2019
Phoenix Real Estate in December: Sales down 9% YoY, Active Inventory up 6% YoY
by Calculated Risk on 1/18/2019 06:28:00 PM
This is a key housing market to follow since Phoenix saw a large bubble / bust followed by strong investor buying.
The Arizona Regional Multiple Listing Service (ARMLS) reports ("Stats Report"):
1) Overall sales declined to 6,403 from 7,070 in December 2017. Sales were down 1.7% from November, and down 9.4% from December 2017.
2) Active inventory was at 18,049, up from 17,017 in December 2017. This is up 6.1% year-over-year. This is the second consecutive month with a YoY increase in active inventory.
The last two months - with a YoY increase - followed twenty-four consecutive months with a YoY decrease in inventory in Phoenix.
Months of supply decreased from 3.30 in November to 3.23 in December. This is still low.
Q4 GDP Forecasts: Mid-to-High 2s
by Calculated Risk on 1/18/2019 02:48:00 PM
From Merrill Lynch:
4Q GDP tracking remains at 2.8%. We forecast 1Q GDP growth of 2.2%, but downside risks are emerging due to the government shutdown. [Jan 18 estimate]From the NY Fed Nowcasting Report
emphasis added
The New York Fed Staff Nowcast stands at 2.6% for 2018:Q4 and 2.2% for 2019:Q1. [Jan 18 estimate]And from the Altanta Fed: GDPNow
The current GDPNow model estimate for real GDP growth (seasonally adjusted annual rate) in the fourth quarter of 2018 is 2.8 percent on January 16, unchanged from January 10. [Jan 16 estimate]CR Note: These estimates suggest GDP in the mid-to-high 2s for Q4.
Consumer Sentiment Declined in January, Lowest since 2006
by Calculated Risk on 1/18/2019 02:38:00 PM
From the University of Michigan: Preliminary Results for January 2019
Consumer sentiment declined in early January to its lowest level since Trump was elected. The decline was primarily focused on prospects for the domestic economy, with the year-ahead outlook for the national economy judged the worst since mid 2014. The loss was due to a host of issues including the partial government shutdown, the impact of tariffs, instabilities in financial markets, the global slowdown, and the lack of clarity about monetary policies.CR Note: Sentiment is a coincident indicator.
emphasis added
BLS: Unemployment Rates Higher in 4 states in December; Lower in 3 States
by Calculated Risk on 1/18/2019 11:49:00 AM
From the BLS: Regional and State Employment and Unemployment Summary
Unemployment rates were higher in December in 4 states, lower in 3 states, and stable in 43 states and the District of Columbia, the U.S. Bureau of Labor Statistics reported today. Fourteen states had jobless rate decreases from a year earlier and 36 states and the District had little or no change.
...
Iowa had the lowest unemployment rate in December, 2.4 percent. Alaska had the highest jobless rate, 6.3 percent.
emphasis added
 Click on graph for larger image.
This graph shows the number of states (and D.C.) with unemployment rates at or above certain levels since January 1976.
At the worst of the great recession, there were 11 states with an unemployment rate at or above 11% (red).
Currently only one state, Alaska, has an unemployment rate at or above 6% (dark blue). Only two states and the D.C. have unemployment rates above 5%; Alaska, West Virginia.
A total of seven states are at the series low.
Industrial Production Increased 0.3% in December
by Calculated Risk on 1/18/2019 09:25:00 AM
From the Fed: Industrial Production and Capacity Utilization
Industrial production increased 0.3 percent in December after rising 0.4 percent in November. For the fourth quarter as a whole, total industrial production moved up at an annual rate of 3.8 percent. In December, manufacturing output increased 1.1 percent, its largest gain since February 2018. The output of mines rose 1.5 percent, but the index for utilities fell 6.3 percent, as warmer-than-usual temperatures lowered the demand for heating. At 109.9 percent of its 2012 average, total industrial production was 4.0 percent higher in December than it was a year earlier. Capacity utilization for the industrial sector rose 0.1 percentage point in December to 78.7 percent, a rate that is 1.1 percentage points below its long-run (1972–2017) average.
emphasis added
 Click on graph for larger image.
This graph shows Capacity Utilization. This series is up 12.0 percentage points from the record low set in June 2009 (the series starts in 1967).
Capacity utilization at 78.7% is 1.1% below the average from 1972 to 2017 and below the pre-recession level of 80.8% in December 2007.
Note: y-axis doesn't start at zero to better show the change.
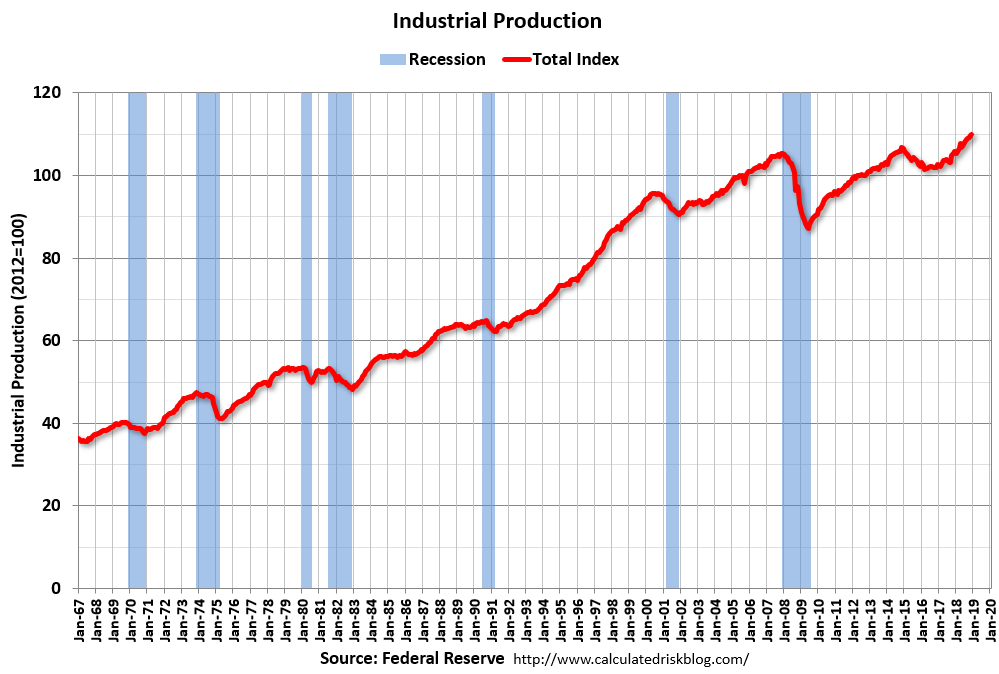 The second graph shows industrial production since 1967.
Industrial production increased in December to 109.9. This is 26% above the recession low, and 4% above the pre-recession peak.
The increase in industrial production was above the consensus forecast. Capacity utilization was also above consensus.


