by Calculated Risk on 7/05/2016 11:36:00 AM
Tuesday, July 05, 2016
Reis: Office Vacancy Rate declined in Q2 to 16.0%
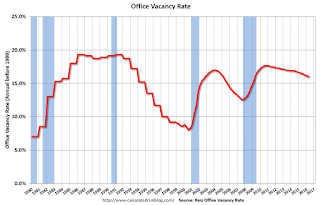
Reis released their Q2 2016 Office Vacancy survey this morning. Reis reported that the office vacancy rate declined to 16.0% in Q2, from 16.1% in Q1. This is down from 16.5% in Q2 2015, and down from the cycle peak of 17.6%.
From Reis Senior Economist and Director of Research Ryan Severino:
For the eighth consecutive quarter, the national vacancy rate declined, falling by 10 basis points to 16.0%. As anticipated, the improvements in the space market are ongoing, but are very slight on a quarter-to-quarter basis. ...
Both asking and effective rents grew by 0.6% during the second quarter, the twenty-second consecutive quarter of asking and effective rent growth. These figures represent a modest decline versus the first quarter when asking and effective rents grew by 0.9% and 1.0% respectively. The 12-month changes for asking and effective rent growth both also slowed slightly versus the figures from the first quarter. Rent growth during the second quarter was likely hampered by the relatively weak demand and somewhat poor performance from the labor market.
 Click on graph for larger image.
This graph shows the office vacancy rate starting in 1980 (prior to 1999 the data is annual).
Reis reported the vacancy rate was at 16.0% in Q2.
Office vacancy data courtesy of Reis.
CoreLogic: House Prices up 5.9% Year-over-year in May
by Calculated Risk on 7/05/2016 09:14:00 AM
Notes: This CoreLogic House Price Index report is for May. The recent Case-Shiller index release was for April. The CoreLogic HPI is a three month weighted average and is not seasonally adjusted (NSA).
From CoreLogic: CoreLogic US Home Price Report Shows Prices Up 5.9 Percent Year Over Year in May 2016
Home prices nationwide, including distressed sales, increased year over year by 5.9 percent in May 2016 compared with May 2015 and increased month over month by 1.3 percent in May 2016 compared with April 2016, according to the CoreLogic HPI.
...
“Housing remained an oasis of stability in May with home prices rising year over year between 5 percent and 6 percent for 22 consecutive months,” said Dr. Frank Nothaft, chief economist for CoreLogic. “The consistently solid growth in home prices has been driven by the highest resale activity in nine years and a still-tight housing inventory.”
emphasis added
 Click on graph for larger image.
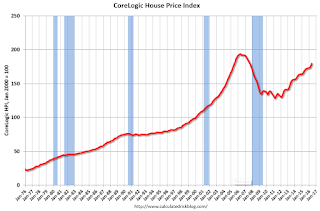
 This graph shows the national CoreLogic HPI data since 1976. January 2000 = 100.
The index was up 1.3% in May (NSA), and is up 5.9% over the last year.
This index is not seasonally adjusted, and this was a solid month-to-month increase.
The index is still 7.2% below the bubble peak in nominal terms (not inflation adjusted).
 The second graph shows the YoY change in nominal terms (not adjusted for inflation).
The YoY increase had been moving sideways over the last year.
The year-over-year comparison has been positive for fifty two consecutive months.
Monday, July 04, 2016
Ouch: Open-ended UK Property Fund suspends trading
by Calculated Risk on 7/04/2016 07:59:00 PM
From FT Alphaville: If you voted for Brexit and like open-ended UK property funds, we have some bad news
From Standard Life Investments as it suspends trading in its £2.9bn UK real estate fund (one of the UK’s largest) because of post-referendum redemption requests:Weekend:
Updating with actual press release:
STANDARD LIFE INVESTMENTS UK REAL ESTATE FUND
Due to exceptional market circumstances, Standard Life Investments has taken the decision to suspend all trading in the Standard Life Investments UK Real Estate Fund (and its associated Feeder Funds) from 12:00 noon on 4July 2016.
The decision was taken following an increase in redemption requests as a result of uncertainty for the UK commercial real estate market following the EU referendum result. ....
• Schedule for Week of July 3, 2016
• Q2 Review: Ten Economic Questions for 2016
Tuesday:
• Early, Reis Q2 2016 Office Survey of rents and vacancy rates.
• At 10:00 AM ET, Manufacturers' Shipments, Inventories and Orders (Factory Orders) for May. The consensus is a 1.0% decrease in orders.
Oil prices were up over the last week with WTI futures at $48.65 per barrel and Brent at $50.10 per barrel. A year ago, WTI was at $57, and Brent was at $59 - so prices are down 20% year-over-year.
Here is a graph from Gasbuddy.com for nationwide gasoline prices. Nationally prices are at $2.26 per gallon (down about $0.50 per gallon from a year ago).
June NFP Forecasts
by Calculated Risk on 7/04/2016 10:30:00 AM
Happy July 4th!
A couple of NFP forecasts ...
From Nomura:
Our June Private Payrolls tracking model ended the month at 124k, a rebound from a dismal reading in May but still below the strong pace of job growth seen previously. We note that our model does not take into account strike workers returning to work in June. Adding back the striking workers to payrolls, we forecast that nonfarm payrolls grew by 160k in June ... we expect the unemployment rate to be unchanged at 4.7%. Last, we expect another month of steady wage gains and forecast a 0.2% m-o-m (+2.7% y-o-y) increase in average hourly earnings in June.From Merrill Lynch:
emphasis added
We expect the June jobs report to reveal a rebound in nonfarm payroll growth to 180,000, following the slowdown in hiring over the last few months. In the last report, payrolls were biased lower by 35,000 due to the Verizon strike. Accounting for a reversal of this effect, true job growth in June would be 145,000. ... The unemployment rate likely ticked up to 4.8% from 4.7% ... We look for another 0.2% pick-up in wages, which would push up the yoy rate by 0.2pp to 2.7%—the highest pace in this cycle.Note that the Verizon strike subtracted from the May report and the workers will be added back in the June report. The June employment report will be released on Friday, and the consensus is for an increase of 180,000 non-farm payroll jobs added in June, up from the 38,000 non-farm payroll jobs added in May. The consensus is for the unemployment rate to increase to 4.8%.
Sunday, July 03, 2016
Q2 Review: Ten Economic Questions for 2016
by Calculated Risk on 7/03/2016 10:59:00 AM
At the end of last year, I posted Ten Economic Questions for 2016. I followed up with a brief post on each question. The goal was to provide an overview of what I expected in 2016 (I don't have a crystal ball, but I think it helps to outline what I think will happen - and understand - and change my mind, when the outlook is wrong).
By request, here is a quick Q2 review. I've linked to my posts from the beginning of the year, with a brief excerpt and a few comments:
10) Question #10 for 2016: How much will housing inventory increase in 2016?
Right now my guess is active inventory will increase in 2016 (inventory will decline seasonally in December and January, but I expect to see inventory up again year-over-year in 2016). I don't expect a double digit surge in inventory, but maybe a mid-single digit increase year-over-year. If correct, this will keep house price increases down in 2015 (probably lower than the 5% or so gains in 2014 and 2015).According to the May NAR report on existing home sales, inventory was down 5.7% year-over-year in May, and the months-of-supply was at 4.7 months. It now appears inventory will decrease in 2016.
9) Question #9 for 2016: What will happen with house prices in 2016?
Low inventories, and a decent economy suggests further price increases in 2016. However I expect we will see prices up less in 2016, than in 2015, as measured by these house price indexes - mostly because I expect more inventory.If is very early, but the Case-Shiller data released last week showed prices up 5.0% year-over-year in April. The price increase is a little lower than in 2015 - even with less inventory.
8) Question #8 for 2016: How much will Residential Investment increase?
My guess is growth of around 4% to 8% in 2016 for new home sales, and about the same percentage growth for housing starts. Also I think the mix between multi-family and single family starts will shift a little more towards single family in 2016.Through May, starts were up 10.2% year-over-year compared to the same period in 2015. New home sales were up 6.4% year-over-year. My guess is both will be increase about 4% to 8% in 2016.
7) Question #7 for 2016: What about oil prices in 2016?
It is impossible to predict an international supply disruption, however if a significant disruption happens, then prices will move higher. Continued weakness in Europe and China seems likely, however sluggish demand will be somewhat offset by less tight oil production. It seems like the key oil producers (Saudi, etc) will continue production at current levels. This suggests in the short run (2016) that prices will stay low, but probably move up a little in 2016. I'll guess WTI will be up from the current price [WTI at $38 per barrel] by December 2016 (but still under $50 per barrel).As of this morning, WTI futures are just over $49 per barrel.
6) Question #6 for 2016: Will real wages increase in 2016?
For this post the key point is that nominal wages have been only increasing about 2% per year with some pickup in 2015. As the labor market continues to tighten, we should start see more wage pressure as companies have to compete more for employees. I expect to see some further increase in nominal wage increases in 2016 (perhaps over 3% later in the year). The year-over-year change in real wages will depend on inflation, and I expect headline CPI to pickup some this year as the impact on headline inflation of declining oil prices fades.Through May 2016, nominal hourly wages were up 2.5% year-over-year. This is a pickup from last year, and so far it appears wages will increase at a faster rate in 2016.
5) Question #5 for 2016: Will the Fed raise rates in 2016, and if so, by how much?
I've seen several people arguing the Fed will be cutting rates by the end of 2016 - I think that is unlikely. Instead I think the Fed will be cautious - and they will not want to reverse course. Right now I think something around three rate hikes in 2016 is likely.Events have pushed the Fed to delay rate increases, and it now looks like zero or one are the most likely number of rate hikes in 2016. My guess is the Fed will hike rates later this year.
4) Question #4 for 2016: Will the core inflation rate rise in 2016? Will too much inflation be a concern in 2016?
Due to some remaining slack in the labor market (example: elevated level of part time workers for economic reasons), I expect these measures of inflation will be close to the Fed's target in 2016.It is early, but inflation has moved up close to the Fed target through May.
So currently I think core inflation (year-over-year) will increase further in 2016, but too much inflation will not be a serious concern in 2016.
3) Question #3 for 2016: What will the unemployment rate be in December 2016?
Depending on the estimate for the participation rate and job growth (next question), it appears the unemployment rate will decline to around 4.5% by December 2016. My guess is based on the participation rate declining slightly in 2016 and for decent job growth in 2016 (however less in 2016 than in 2015).The unemployment rate was 4.7% in May, down from 5.0% in December. I still expect the unemployment rate to decline into the mid-4s.
2) Question #2 for 2016: How many payroll jobs will be added in 2016?
Energy related construction hiring will decline in 2016, but I expect other areas of construction to be solid. For manufacturing, growth in the auto sector will probably slow this year, but the drag on manufacturing employment from the strong dollar should be less in 2016.Through May 2016, the economy has added 748,000 thousand jobs; or 150,000 per month. It now appears employment gains will be somewhat below 200,000 per month in 2016.
As I mentioned above, in addition to layoffs in the energy sector, exporters will have a difficult year - but probably not the severe contraction as in 2015, and more companies will have difficulty finding qualified candidates. Even with some boost from lower oil prices - and some additional public hiring, I expect total jobs added to be lower in 2016 than in 2015.
So my forecast is for gains of around 200,000 payroll jobs per month in 2015. Lower than in 2015, but another solid year for employment gains given current demographics.
1) Question #1 for 2016: How much will the economy grow in 2016?
In addition, the sharp decline in oil prices should be a net positive for the US economy in 2016. And, hopefully, the negative impact from the strong dollar will fade in 2016. The most likely growth rate is in the mid-2% range again ...GDP growth was sluggish again in Q1 (just up 1.1% annualized), and GDP is now tracking 2.6% in Q2.
Currently it looks like 2016 is unfolding somewhat as expected - although I'd revise down my forecast for FOMC rate hikes from 3 to 1, and revise down my employment forecast a little. It is interesting that housing inventory is declining again this year.
Saturday, July 02, 2016
Schedule for Week of July 3, 2016
by Calculated Risk on 7/02/2016 08:09:00 AM
Happy 4th of July!
The key report this week is the June employment report on Friday.
Other key indicators include the June ISM non-manufacturing index, and the May trade deficit.
Also the quarterly Reis surveys for office, apartment and malls will be released this week.
All US markets will be closed in observance of Independence Day.
Early: Reis Q2 2016 Office Survey of rents and vacancy rates.
10:00 AM: Manufacturers' Shipments, Inventories and Orders (Factory Orders) for May. The consensus is a 1.0% decrease in orders.
7:00 AM ET: The Mortgage Bankers Association (MBA) will release the results for the mortgage purchase applications index.
Early: Reis Q2 2016 Apartment Survey of rents and vacancy rates.
 8:30 AM: Trade Balance report for May from the Census Bureau.
 This graph shows the U.S. trade deficit, with and without petroleum, through April. The blue line is the total deficit, and the black line is the petroleum deficit, and the red line is the trade deficit ex-petroleum products.
The consensus is for the U.S. trade deficit to be at $40.0 billion in May from $37.4 billion in April.
10:00 AM: the ISM non-Manufacturing Index for June. The consensus is for index to increase to 53.3 from 52.9 in May.
2:00 PM: FOMC Minutes for the Meeting of June 14-15, 2016
8:15 AM: The ADP Employment Report for June. This report is for private payrolls only (no government). The consensus is for 150,000 payroll jobs added in June, down from 173,000 added in May.
8:30 AM: The initial weekly unemployment claims report will be released. The consensus is for 269 thousand initial claims, up from 268 thousand the previous week.
Early: Reis Q2 2016 Mall Survey of rents and vacancy rates.
8:30 AM: Employment Report for June. The consensus is for an increase of 180,000 non-farm payroll jobs added in June, up from the 38,000 non-farm payroll jobs added in May.
The consensus is for the unemployment rate to increase to 4.8%.
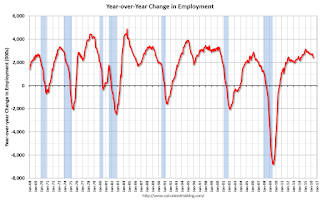
 This graph shows the year-over-year change in total non-farm employment since 1968.
In May, the year-over-year change was 2.39 million jobs.
A key will be the change in wages.
3:00 PM: Consumer credit from the Federal Reserve. The consensus is for a $16.0 billion increase in credit.
Friday, July 01, 2016
"6-Day Winning Streak Leaves Mortgage Rates Near All-Time Lows"
by Calculated Risk on 7/01/2016 06:09:00 PM
From Matthew Graham at Mortgage News Daily: 6-Day Winning Streak Leaves Rates Near All-Time Lows
Mortgage rates fell moderately today, adding a 6th day to a winning streak that began with last week's Brexit news and bringing rates right to the brink of all-time lows.... bringing some lenders from 3.625% to 3.375%, which is now the most prevalently-quoted conventional 30yr fixed rate on top tier scenarios.Here is a table from Mortgage News Daily:
Why is 3.375% important? Simply put, the next time rates move a notch lower, they'll be back to official all-time lows. In fact, 3.375% is the lowest rate that markets were able to maintain for more than a day or two back in 2012.
emphasis added
U.S. Light Vehicle Sales decrease to 16.6 million annual rate in June
by Calculated Risk on 7/01/2016 03:00:00 PM
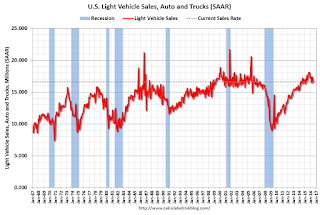
Based on a preliminary estimate from WardsAuto, light vehicle sales were at a 16.62 million SAAR in June.
That is down about 2% from June 2015, and down 4% from the 17.39 million annual sales rate last month.
Click on graph for larger image.
This graph shows the historical light vehicle sales from the BEA (blue) and an estimate for June (red, light vehicle sales of 16.62 million SAAR from WardsAuto).
This was below the consensus forecast of 17.3 million SAAR (seasonally adjusted annual rate).
The second graph shows light vehicle sales since the BEA started keeping data in 1967.

Sales for 2016 - through the first half - are up about 1% from the comparable period last year.
Construction Spending decreased 0.8% in May
by Calculated Risk on 7/01/2016 12:11:00 PM
Earlier today, the Census Bureau reported that overall construction spending decreased 0.8% in May compared to April:
The U.S. Census Bureau of the Department of Commerce announced today that construction spending during May 2016 was estimated at a seasonally adjusted annual rate of $1,143.3 billion, 0.8 percent below the revised April estimate of $1,152.4 billion. The May figure is 2.8 percent above the May 2015 estimate of $1,112.2 billion.Private and public spending decreased in May:
Spending on private construction was at a seasonally adjusted annual rate of $859.3 billion, 0.3 percent below the revised April estimate of $861.9 billion. ...
In May, the estimated seasonally adjusted annual rate of public construction spending was $284.0 billion, 2.3 percent below the revised April estimate of $290.5 billion.
emphasis added
 Click on graph for larger image.
This graph shows private residential and nonresidential construction spending, and public spending, since 1993. Note: nominal dollars, not inflation adjusted.
Private residential spending has been generally increasing, but is 33% below the bubble peak.
Non-residential spending is only 2% below the peak in January 2008 (nominal dollars).
Public construction spending is now 13% below the peak in March 2009.
 The second graph shows the year-over-year change in construction spending.
On a year-over-year basis, private residential construction spending is up 5%. Non-residential spending is up 4% year-over-year. Public spending is down 3% year-over-year.
Looking forward, all categories of construction spending should increase in 2016. Residential spending is still fairly low, non-residential is increasing (except oil and gas), and public spending is also generally increasing after several years of austerity.
This was well below the consensus forecast of a 0.6% increase for May, however construction spending for the previous two years were revised up.
ISM Manufacturing index increased to 53.2 in June
by Calculated Risk on 7/01/2016 10:10:00 AM
The ISM manufacturing index indicated expansion for the fourth consecutive month in June, following five months of contraction. The PMI was at 53.2% in June, up from 51.3% in May. The employment index was at 50.4%, up from 49.2% in May, and the new orders index was at 57.0%, up from 55.7% in May.
From the Institute for Supply Management: June 2016 Manufacturing ISM® Report On Business®
Economic activity in the manufacturing sector expanded in June for the fourth consecutive month, while the overall economy grew for the 85th consecutive month, say the nation's supply executives in the latest Manufacturing ISM®Report On Business®.
The report was issued today by Bradley J. Holcomb, CPSM, CPSD, chair of the Institute for Supply Management® (ISM®) Manufacturing Business Survey Committee. "The June PMI® registered 53.2 percent, an increase of 1.9 percentage points from the May reading of 51.3 percent. The New Orders Index registered 57 percent, an increase of 1.3 percentage points from the May reading of 55.7 percent. The Production Index registered 54.7 percent, 2.1 percentage points higher than the May reading of 52.6 percent. The Employment Index registered 50.4 percent, an increase of 1.2 percentage points from the May reading of 49.2 percent. Inventories of raw materials registered 48.5 percent, an increase of 3.5 percentage points from the May reading of 45 percent. The Prices Index registered 60.5 percent, a decrease of 3 percentage points from the May reading of 63.5 percent, indicating higher raw materials prices for the fourth consecutive month. Manufacturing registered growth in June for the fourth consecutive month, as 12 of our 18 industries reported an increase in new orders in June (down from 14 in May), and 12 of our 18 industries reported an increase in production in June (same as in May)."
emphasis added
 Click on graph for larger image.
Here is a long term graph of the ISM manufacturing index.
This was above expectations of 51.5%, and suggests manufacturing expanded at a faster pace in June than in May.


