 RSS Feed
 by Calculated Risk on 2/17/2016 03:47:00 PM
Wednesday, February 17, 2016
Comments on January Housing Starts
Earlier: Housing Starts declined to 1.099 Million Annual Rate in January
Below is an update to the graph comparing multi-family starts and completions. Since it usually takes over a year on average to complete a multi-family project, there is a lag between multi-family starts and completions. Completions are important because that is new supply added to the market, and starts are important because that is future new supply (units under construction is also important for employment).
These graphs use a 12 month rolling total for NSA starts and completions.
 The blue line is for multifamily starts and the red line is for multifamily completions.
The rolling 12 month total for starts (blue line) increased steadily over the last few years, and completions (red line) have lagged behind - but completions have been catching up (more deliveries), and will continue to follow starts up (completions lag starts by about 12 months).
Multi-family completions are increasing sharply year-over-year.
I think most of the growth in multi-family starts is probably behind us - in fact multi-family starts might have peaked in June 2015 (at 510 thousand SAAR) - although I expect solid multi-family starts for a few more years (based on demographics).
 The second graph shows single family starts and completions. It usually only takes about 6 months between starting a single family home and completion - so the lines are much closer. The blue line is for single family starts and the red line is for single family completions.
Note the exceptionally low level of single family starts and completions. The "wide bottom" was what I was forecasting several years ago, and now I expect several years of increasing single family starts and completions.
The housing recovery continues, but I expect less growth from multi-family going forward.
 This third graph shows the month to month comparison between 2015 (blue) and 2016 (red).
The year-over-year comparison will be easier in February and March.
FOMC Minutes: Economic and Financial developments "increasing the downside risks to the outlook"
by Calculated Risk on 2/17/2016 02:18:00 PM
From the Fed: Minutes of the Federal Open Market Committee, January 26-27. Excerpts:
In their discussion of the economic situation and the outlook, meeting participants saw the information received over the intermeeting period as suggesting that labor market conditions had improved further in late 2015 even as economic growth slowed. Household and business spending had been increasing at moderate rates; however, net exports had been soft and inventory investment had slowed. A range of labor market indicators pointed to some additional decline in underutilization of labor resources. Inflation continued to run below the Committee's 2 percent longer-run objective, partly reflecting declines in energy prices and in prices of non-energy imports. Market-based measures of inflation compensation declined further over the intermeeting period; survey-based measures of longer-term inflation expectations were little changed, on balance, in recent months.
In considering the outlook for economic activity, participants weighed the divergent signals from recent strength in the labor market and the modest increase in real GDP suggested by the available data on spending and production. In part, the projected slow growth of real GDP in the fourth quarter of 2015 appeared to be caused by reduced inventory investment and a weather-related slowing in consumer spending on energy services--developments that would likely be reversed in the current quarter. Moreover, some participants noted that the preliminary spending data and initial estimates of GDP are often revised substantially, and they judged that labor market indicators tended to provide a more reliable early reading on the economy's underlying strength.
In assessing the medium-term outlook, participants discussed the extent to which the recent turbulence in global financial markets might restrain U.S. economic activity. While acknowledging the possible adverse effects of the tightening of financial conditions that had occurred, most policymakers thought that the extent to which tighter conditions would persist and what that might imply for the outlook were unclear, and they therefore judged that it was premature to alter appreciably their assessment of the medium-term economic outlook. They continued to anticipate that economic activity would expand at a moderate pace over the medium term and that the labor market would continue to strengthen. Inflation was expected to remain low in the near term, in part because of the further decline in energy prices. However, most participants continued to anticipate that inflation would rise to 2 percent over the medium term as the transitory effects of declines in energy and import prices dissipated and the labor market strengthened further. Given their increased uncertainty about how global economic and financial developments might evolve, participants emphasized the importance of closely monitoring these developments and of assessing their implications for the labor market and inflation, and for the balance of risks to the outlook.
...
Participants also discussed a range of issues related to financial market developments. Almost all participants cited a number of recent events as indicative of tighter financial conditions in the United States; these events included declines in equity prices, a widening in credit spreads, a further rise in the exchange value of the dollar, and an increase in financial market volatility. Some participants also pointed to significantly tighter financing conditions for speculative-grade firms and small businesses, and to reports of tighter standards at banks for C&I and CRE loans. The effects of these financial developments, if they were to persist, may be roughly equivalent to those from further firming in monetary policy. Participants mentioned several apparent factors underlying the recent financial market turbulence, including economic and financial developments in China and other foreign countries, spillovers in financial markets from stresses at firms and in countries that are producers of energy and other commodities, and an increase in concerns among market participants regarding the prospects for domestic economic growth. However, a number of participants noted that the large magnitude of changes in domestic financial market conditions was difficult to reconcile with incoming information on U.S. economic developments. A couple of participants pointed out that the recent decline in equity prices could be viewed as bringing equity valuations more in line with historical norms. Additionally, a few participants cautioned that valuations in CRE markets should be closely monitored. The effects of a relatively flat yield curve and low interest rates in reducing banks' net interest margins were also noted.
Participants discussed whether their current assessments of economic conditions and the medium-term outlook warranted either increasing the target range for the federal funds rate at this meeting or altering their earlier views of the appropriate path for the target range for the federal funds rate. Participants agreed that incoming indicators regarding labor market developments had been encouraging, but also that data releases since the December meeting on spending and production had been disappointing. Furthermore, developments in commodity and financial markets as well as the possibility of a significant weakening of some foreign economies had the potential to further restrain domestic economic activity, partly because the large cumulative declines in energy and other commodity prices could have pronounced adverse effects on some firms and countries that are important producers of such commodities. However, a few noted that the potential positive effects of lower energy costs on economic activity were a mitigating factor. Participants judged that the overall implication of these developments for the outlook for domestic economic activity was unclear, but they agreed that uncertainty had increased, and many saw these developments as increasing the downside risks to the outlook.
emphasis added
AIA: "Slight Contraction in Architecture Billings Index "
by Calculated Risk on 2/17/2016 11:44:00 AM
Note: This index is a leading indicator primarily for new Commercial Real Estate (CRE) investment.
From the AIA: Slight Contraction in Architecture Billings Index
Following a generally positive performance in 2015, the Architecture Billings Index has begun this year modestly dipping back into negative terrain. As a leading economic indicator of construction activity, the ABI reflects the approximate nine to twelve month lead time between architecture billings and construction spending. The American Institute of Architects (AIA) reported the January ABI score was 49.6, down slightly from the mark of 51.3 in the previous month. This score reflects a minor decrease in design services (any score above 50 indicates an increase in billings). The new projects inquiry index was 55.3, down from a reading of 60.5 the previous month.
“The fundamentals are mostly sound in the nonresidential design and construction market,” said AIA Chief Economist, Kermit Baker, Hon. AIA, PhD. “January was a rocky month throughout the economy, with falling oil prices, international economic concerns, and with steep declines in stock market valuations in the U.S. and elsewhere. Some of the fallout of this uncertainty may have affected progress on design projects.”
...
• Regional averages: West (50.8), Northeast (50.4), South (50.3), Midwest (48.9)
• Sector index breakdown: multi-family residential (51.9), commercial / industrial (50.5), institutional (49.9), mixed practice (49.0)
emphasis added
 Click on graph for larger image.
This graph shows the Architecture Billings Index since 1996. The index was at 49.6 in January, down from 51.3 in December. Anything below 50 indicates contraction in demand for architects' services.
Note: This includes commercial and industrial facilities like hotels and office buildings, multi-family residential, as well as schools, hospitals and other institutions.
The multi-family residential market was negative for most of last year - suggesting a slowdown or less growth for apartments - but has been positive for the last four months.
According to the AIA, there is an "approximate nine to twelve month lag time between architecture billings and construction spending" on non-residential construction. This index was positive in 8 of the last 12 months, suggesting a further increase in CRE investment in 2016.
Fed: Industrial Production increased 0.9% in January
by Calculated Risk on 2/17/2016 09:25:00 AM
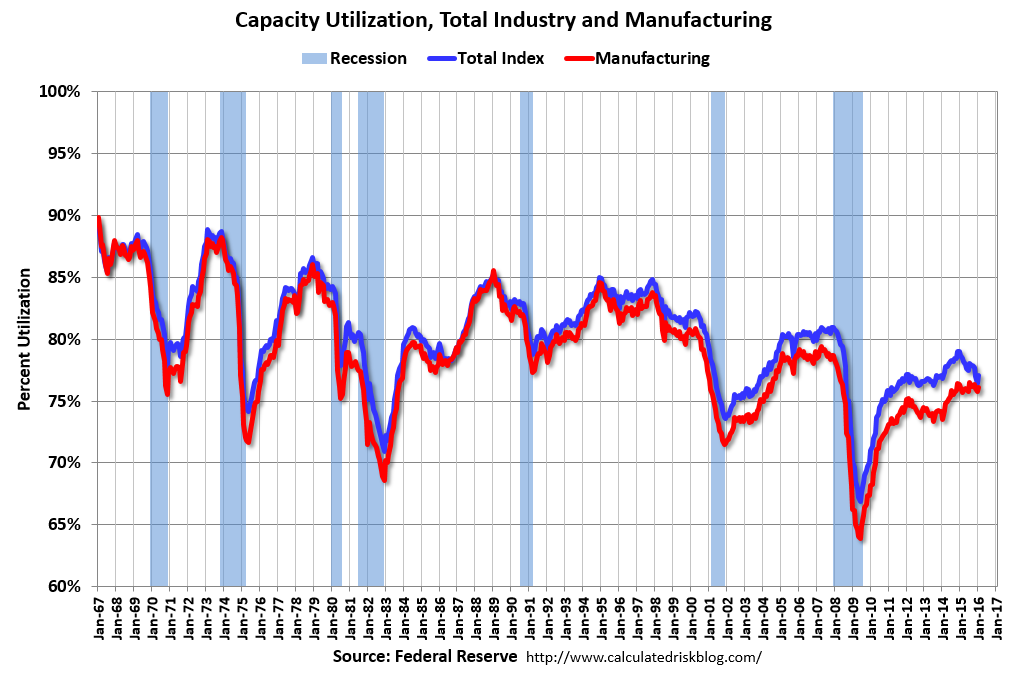
From the Fed: Industrial production and Capacity Utilization
Industrial production increased 0.9 percent in January after decreasing 0.7 percent in December. A storm late in the month likely held down production in January by a small amount. The index for utilities jumped 5.4 percent; demand for heating moved up markedly after having been suppressed by unseasonably warm weather in December. Manufacturing output increased 0.5 percent in January and was 1.2 percent above its year-earlier level. Mining production was unchanged following four months with declines that averaged about 1 1/2 percent per month. At 106.8 percent of its 2012 average, total industrial production in January was 0.7 percent below its year-earlier level. Capacity utilization for the industrial sector increased 0.7 percentage point in January to 77.1 percent, a rate that is 2.9 percentage points below its long-run (1972–2015) average.
emphasis added
 Click on graph for larger image.
This graph shows Capacity Utilization. This series is up 10.2 percentage points from the record low set in June 2009 (the series starts in 1967).
Capacity utilization at 77.1% is 2.9% below the average from 1972 to 2015 and below the pre-recession level of 80.8% in December 2007.
Note: y-axis doesn't start at zero to better show the change.
 The second graph shows industrial production since 1967.
Industrial production increased 0.9% in January to 106.8. This is 22.5% above the recession low, and 1.5% above the pre-recession peak.
This was above expectations of a 0.4% decrease, as production bounced back from the decline in December (mostly due to weather).
Housing Starts declined to 1.099 Million Annual Rate in January
by Calculated Risk on 2/17/2016 08:37:00 AM
From the Census Bureau: Permits, Starts and Completions
Housing Starts:
Privately-owned housing starts in January were at a seasonally adjusted annual rate of 1,099,000. This is 3.8 percent below the revised December estimate of 1,143,000, but is 1.8 percent above the January 2015 rate of 1,080,000.
Single-family housing starts in January were at a rate of 731,000; this is 3.9 percent below the revised December figure of 761,000. The January rate for units in buildings with five units or more was 354,000.
Building Permits:
Privately-owned housing units authorized by building permits in January were at a seasonally adjusted annual rate of 1,202,000. This is 0.2 percent below the revised December rate of 1,204,000, but is 13.5 percent above the January 2015 estimate of 1,059,000.
Single-family authorizations in January were at a rate of 720,000; this is 1.6 percent below the revised December figure of 732,000. Authorizations of units in buildings with five units or more were at a rate of 442,000 in January.
emphasis added
 Click on graph for larger image.
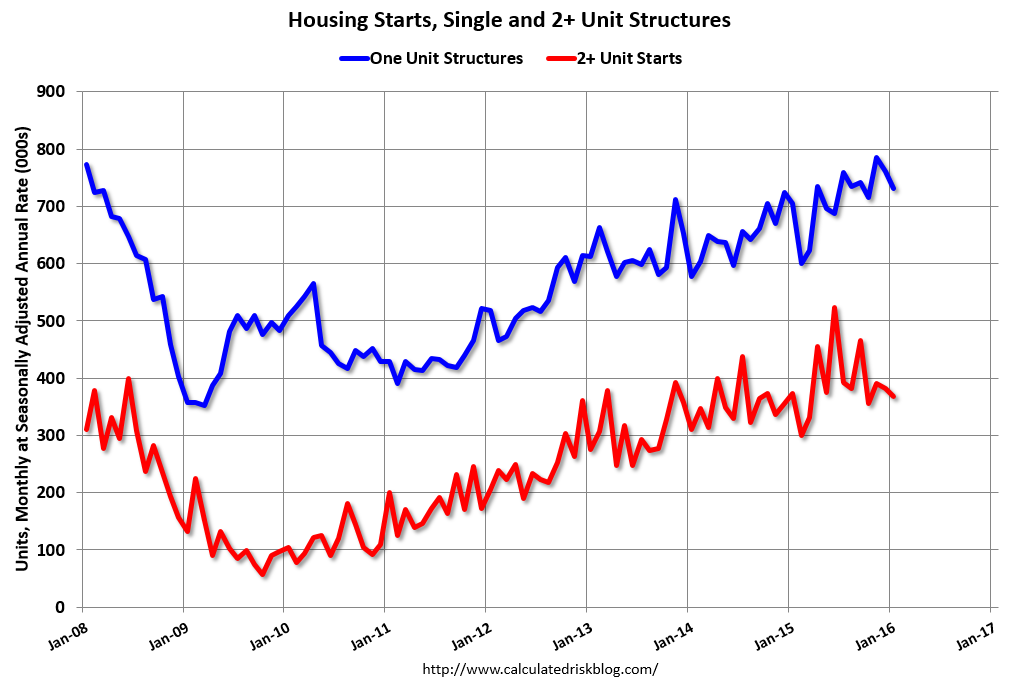
The first graph shows single and multi-family housing starts for the last several years.
Multi-family starts (red, 2+ units) decreased in January. Multi-family starts are down 2% year-over-year.
Single-family starts (blue) decreased in January and are up 3.5% year-over-year.
 The second graph shows total and single unit starts since 1968.
 The second graph shows the huge collapse following the housing bubble, and then - after moving sideways for a couple of years - housing is now recovering (but still historically low),
Total housing starts in January were below expectations. I'll have more later ...
MBA: Mortgage Applications Increased in Latest Weekly Survey, Purchase Applications up 30% YoY
by Calculated Risk on 2/17/2016 07:00:00 AM
From the MBA: Refinance Applications Drive Increase in Latest MBA Weekly Survey
Mortgage applications increased 8.2 percent from one week earlier, according to data from the Mortgage Bankers Association’s (MBA) Weekly Mortgage Applications Survey for the week ending February 12, 2016.
...
The Refinance Index, Conventional Refinance Index and Government Refinance Index increased 16 percent from the previous week, reaching their highest levels since January 2015. The seasonally adjusted Purchase Index decreased 4 percent from one week earlier. The unadjusted Purchase Index increased 2 percent compared with the previous week and was 30 percent higher than the same week one year ago.
...
The average contract interest rate for 30-year fixed-rate mortgages with conforming loan balances ($417,000 or less) decreased to its lowest level since April 2015, 3.83 percent, from 3.91 percent, with points decreasing to 0.36 from 0.41 (including the origination fee) for 80 percent loan-to-value ratio (LTV) loans.
emphasis added
 Click on graph for larger image.
The first graph shows the refinance index since 1990.
Refinance activity was higher in 2015 than in 2014, but it was still the third lowest year since 2000.
Refinance activity has picked up recently as rates have declined.
 The second graph shows the MBA mortgage purchase index.
 According to the MBA, the unadjusted purchase index is 30% higher than a year ago.
Tuesday, February 16, 2016
Wednesday: Housing Starts, PPI, FOMC Minutes and More
by Calculated Risk on 2/16/2016 06:49:00 PM
Wednesday:
• At 7:00 AM ET, the Mortgage Bankers Association (MBA) will release the results for the mortgage purchase applications index.
• At 8:30 AM, Housing Starts for January. The consensus is for 1.175 million starts, up from December.
• At 8:30 AM, the Producer Price Index for January from the BLS. The consensus is for a 0.2% decrease in prices, and a 0.1% increase in core PPI.
• At 9:15 AM, The Fed will release Industrial Production and Capacity Utilization for January. The consensus is for a 0.4% decrease in Industrial Production, and for Capacity Utilization to increase to 76.7%.
• During the day: the AIA's Architecture Billings Index for January (a leading indicator for commercial real estate).
• At 2:00 PM, the Fed will release the FOMC Minutes for the Meeting of January 26-27, 2016
SoCal home sales increased 7.3% YoY in January
by Calculated Risk on 2/16/2016 02:01:00 PM
From the LA Times: Southern California home sales increase in January compared with a year earlier
Southern California home sales in January posted a 7.3% gain compared with the same month a year ago, marking the strongest January for sales since 2013, according to real estate data released Tuesday.The NAR will report January existing home sales on Tuesday, Feb 23rd.
Last month, 14,619 new and existing homes and condominiums were sold in Southern California, according to data firm CoreLogic. ...
"Some people prefer not to buy and sell during the holidays or in the middle of winter, so January and February tend to be relatively weak months for closings and, as such, they're not especially predictive of what's to come for the rest of the year," he said in a statement.
NAHB: Builder Confidence declined to 58 in February
by Calculated Risk on 2/16/2016 10:25:00 AM
The National Association of Home Builders (NAHB) reported the housing market index (HMI) was at 58 in February, down from 61 in January (revised up). Any number above 50 indicates that more builders view sales conditions as good than poor.
From the NAHB: Builder Confidence Drops Three Points in February
Builder confidence in the market for newly-built single-family homes fell three points to 58 in February from an upwardly revised January reading of 61 on the National Association of Home Builders/Wells Fargo Housing Market Index (HMI).
“Though builders report the dip in confidence this month is partly attributable to the high cost and lack of availability of lots and labor, they are still positive about the housing market,” said NAHB Chairman Ed Brady, a home builder and developer from Bloomington, Ill. “Of note, they expressed optimism that sales will pick up in the coming months.”
“Builders are reflecting consumers’ concerns about recent negative economic trends,” said NAHB Chief Economist David Crowe. “However, the fundamentals are in place for continued growth of the housing market. Historically low mortgage rates, steady job gains, improved household formations and significant pent up demand all point to a gradual upward trend for housing in the year ahead.”
...
The HMI component measuring sales expectations in the next six months rose one point to 65 in February. The index measuring current sales condition fell three points to 65 and the component charting buyer traffic dropped five points to 39.
Looking at the three-month moving averages for regional HMI scores, all four regions registered slight declines. The Midwest fell one point to 57, the West registered a three-point drop to 72 and the Northeast and South each posted a two-point decline to 47 and 59, respectively.
emphasis added
 Click on graph for larger image.
This graph show the NAHB index since Jan 1985.
This was below the consensus forecast of 61, but still a strong reading.
NY Fed: "Business activity continued to decline for New York manufacturers" in February
by Calculated Risk on 2/16/2016 08:36:00 AM
From the NY Fed: Empire State Manufacturing Survey
Business activity declined for a seventh consecutive month for New York manufacturing firms, according to the February 2016 survey. After dropping to its lowest level since the Great Recession in January, the general business conditions index edged up three points to -16.6. The new orders index climbed twelve points to -11.6, indicating that orders fell, though at a slower pace than last month.This was below the consensus forecast of -10.0, and indicates manufacturing continued to contract in the NY region.
...
The index for number of employees rose twelve points to -1.0, indicating that employment levels were flat, and the average workweek index held steady at -6.0, signaling that the average workweek shortened.


