 RSS Feed
 by Calculated Risk on 4/02/2014 03:24:00 PM
Wednesday, April 02, 2014
Research: "The Overhang of Structures before and since the Great Recession"
From Margaret Jacobson and Filippo Occhino at the Cleveland Fed: The Overhang of Structures before and since the Great Recession
The economic recovery in the US has been atypically weak, and one reason for this weakness is the failure of investment to rebound as strongly as it has in previous recoveries. We are four and a half years into the recovery, and yet the real level of investment spending by businesses, households, and nonprofits on structures, equipment, and software is still below its pre-recession peak.CR Note: I think most of the "overhang" has been absorbed for residential, although there is still an overhang for office and retail (vacancy rates are still high).
In turn, the current low level of investment is mainly the result of an exceptionally large and persistent drop in one of its key components, investment in structures. Structures include both residential buildings, such as homes and apartment buildings, and nonresidential buildings, such as factories, office buildings, stores, and hospitals. After peaking in early 2006, investment in residential and nonresidential structures dropped by an unprecedented 45 percent, and it began to recover late, two years after the official beginning of the recovery. Currently, it is still 29 percent below its pre-recession peak. By comparison, investment in equipment dropped by 31 percent during the recession, but it began to pick up right when the recovery started and is now above its previous peak ...
Why is investment in structures so low? One reason that is often cited is overhang, the idea that the excess, or overhang, of structures that have been built in the past is now holding investment down. Using a new indicator of the optimal level of structures—the level that would be warranted by economic conditions—we measure the level of overhang before, during, and since the recession. We find evidence that investment in structures was too high in the years leading up to the recession and that an overhang of structures has held down investment growth during the recovery.
...
According to our measure, structure overhang in the private sector increased in the first half of the 2000s, peaking at 21 percent in 2006. It remained elevated throughout 2009, and then declined rapidly during the recovery, reaching 11 percent in 2012. This suggests that overhang built up because of excessive investment before the crisis, rather than resulting from the unanticipated drop in economic activity during the Great Recession.
Reis: Apartment Vacancy Rate declined to 4.0% in Q1 2014
by Calculated Risk on 4/02/2014 10:11:00 AM
Reis reported that the apartment vacancy rate declined in Q1 to 4.0% from 4.2% in Q4 2013. In Q1 2013 (a year ago) the vacancy rate was at 4.4%, and the rate peaked at 8.0% at the end of 2009.
Some data and comments from Reis Senior Economist Ryan Severino:
Vacancy declined by 20 basis points during first quarter to 4.0%, a slight improvement over last quarter’s 10 basis point decline. Over the last twelve months the national vacancy rate has declined by 40 basis points, more or less the same pace as the last few quarters. Demand for apartments remains strong four years after the recovery began while inclement weather had a negative impact on construction activity. The national vacancy rate now stands 400 basis points below the cyclical peak of 8.0% observed right after the recession concluded in late 2009.
Resilient demand continued to shrug off seasonal weakness with a strong showing in the first quarter. The sector absorbed 41,570 units, down slightly versus last quarter’s 48,546 but nonetheless the largest figure for a first quarter since 2011. Moreover, the market is displaying incredible strength, continuing to absorb this many units four years after the advent of the recovery. Meanwhile, completions during the first quarter totaled 25,135 units. This is a pullback from last quarter’s 45,073, though inclement weather surely had some impact on this. As we have been warning, construction is clearly on an upswing, and bad weather is only likely to delay, not cancel projects. For 2014, we still expect roughly 162,000 units to be delivered so we should expect significant completions figures during the subsequent quarters of 2014.
Asking and effective rents grew by 0.5% and 0.6%, respectively, during the first quarter. This is a minor decrease from the fourth quarter and the lowest figure since the first quarter of 2013. Rent growth remains relatively weak given the fact that the apartment market is at a miniscule 4.0% vacancy rate. Normally at such a low vacancy rate, rent growth is at least 100 basis points above current growth rates on an annual basis. Rent growth is being held back by the fact that rents (on a nominal basis) are at record‐high levels and the labor market is still relatively weak, generating little compensation increases for many workers. The marriage of these two factors is making it difficult for landlords in many markets to increase rents at a faster pace.
...
Demand for apartments is seemingly insatiable. Although the labor market got off to sluggish start in 2014, we still expect the recovery to accelerate which should support ongoing demand for apartment units. However, the slight pullback in construction this quarter was due to seasonal factors and construction remains on pace for roughly 162,000 new units to be completed this year. This is above the long‐term historical average of roughly 125,000 units/year and this will make it difficult for demand to keep exceeding completions. Therefore, we anticipate that for the first time since 2009 the national vacancy rate will not fall in 2014. We anticipate that vacancy will be more or less flat this year. However, our general position on 2014 has not been altered ‐ still low vacancy, an improving economy and labor market, and lots of newly completed Class A properties coming online with rents higher than the market average will all conspire to push asking and effective rents up by roughly 3.3% next year.
emphasis added
 Click on graph for larger image.
This graph shows the apartment vacancy rate starting in 1980. (Annual rate before 1999, quarterly starting in 1999). Note: Reis is just for large cities.
Apartment vacancy data courtesy of Reis.
ADP: Private Employment increased 191,000 in March
by Calculated Risk on 4/02/2014 08:21:00 AM
Private sector employment increased by 191,000 jobs from February to March according to the March ADP National Employment Report®. ... The report, which is derived from ADP’s actual payroll data, measures the change in total nonfarm private employment each month on a seasonally-adjusted basis.This was at the consensus forecast for 190,000 private sector jobs added in the ADP report.
...
Mark Zandi, chief economist of Moody’s Analytics, said, "The job market is coming out from its deep winter slumber. Job gains are consistent with the pace prior to the brutal winter. The gains are broad based across industries and business size classes. Even better numbers are likely in coming months as the weather warms.”
Note: ADP hasn't been very useful in directly predicting the BLS report on a monthly basis, but it might provide a hint. The BLS report for March will be released on Friday.
MBA: Mortgage Purchase Applications Increase, Refinance Applications Decrease
by Calculated Risk on 4/02/2014 07:01:00 AM
From the MBA: Mortgage Purchase Applications Increase in Latest MBA Weekly Survey
Mortgage applications decreased 1.2 percent from one week earlier, according to data from the Mortgage Bankers Association’s (MBA) Weekly Mortgage Applications Survey for the week ending March 28, 2014. ...
The Refinance Index decreased 3 percent from the previous week. The seasonally adjusted Purchase Index increased 1 percent from one week earlier. ...
The average contract interest rate for 30-year fixed-rate mortgages with conforming loan balances ($417,000 or less) was unchanged at 4.56 percent, with points increasing to 0.31 from 0.29 (including the origination fee) for 80 percent loan-to-value ratio (LTV) loans.
emphasis added
 Click on graph for larger image.
The first graph shows the refinance index.
The refinance index is down 73% from the levels in May 2013.
With the mortgage rate increases, refinance activity will be significantly lower in 2014 than in 2013.
 The second graph shows the MBA mortgage purchase index.
 The 4-week average of the purchase index is now down about 19% from a year ago.
The purchase index is probably understating purchase activity because small lenders tend to focus on purchases, and those small lenders are underrepresented in the purchase index - but this is still very weak.
Tuesday, April 01, 2014
Wednesday: ADP Employment, Q1 Apartment Vacancy Survey
by Calculated Risk on 4/01/2014 08:07:00 PM
There has been a debate about whether the recent economic weakness was weather related or something more serious. Readers of Atif Mian and Amir Sufi's House of Debt were fairly confident much of the weakness was weather related.
In mid-March, Mian and Sufi wrote: Weakening Economy or Just Bad Winter?
We use state-level data on new auto purchases to attack this question. Here is the basic idea. Not all states experienced a horrible January 2014 — in fact, much of the western part of the country actually was warmer than normal. We can use this variation across the country in January weather to see if national auto sales were brought down by states that experienced abnormally cold temperatures.Bottom line: the weather had a significant impact on auto sales. And their follow-up today (following the strong auto sales report): Auto Sales and Weather
...
The evidence is pretty clear. New auto purchases in January 2014 were more than 5% down in states that were more than 7 degrees below their normal January temperature. New auto purchases were down slightly in states that were between -7 and -4 degrees below normal. In the rest of the country where temperatures were closer to normal, new auto purchases were quite strong.
Our post three weeks ago on the weather and auto sales argued that bad winter weather was responsible for the slowdown in consumer spending. ... We concluded: “When it comes to durable goods such as cars, it is likely that purchases will increase sharply when the weather improves in the states that had extremely cold winters.”Wednesday:
We now have an out-of-sample test of our conclusion: March estimates of new auto sales are out, and they are higher than at any other point since 2007.
• Early: Reis Q1 2014 Apartment Survey of rents and vacancy rates.
• At 7:00 AM ET, the Mortgage Bankers Association (MBA) will release the results for the mortgage purchase applications index.
• At 8:15 AM, the ADP Employment Report for March. This report is for private payrolls only (no government). The consensus is for 190,000 payroll jobs added in March, up from 139,000 in February.
• At 10:00 AM, the Manufacturers' Shipments, Inventories and Orders (Factory Orders) for February. The consensus is for a 0.8% increase in February orders.
CoreLogic: House Prices up 12.2% Year-over-year in February
by Calculated Risk on 4/01/2014 05:45:00 PM
Notes: This CoreLogic House Price Index report is for February. The recent Case-Shiller index release was for January. The CoreLogic HPI is a three month weighted average and is not seasonally adjusted (NSA).
From CoreLogic: CoreLogic Reports Home Prices Rise by 12.2 Percent Year Over Year in February
Home prices nationwide, including distressed sales, increased 12.2 percent in February 2014 compared to February 2013. This change represents 24 months of consecutive year-over-year increases in home prices nationally. On a month-over-month basis, home prices nationwide, including distressed sales, increased by 0.8 percent in February 2014 compared to January 2014.
Excluding distressed sales, home prices nationally increased 10.7 percent in February 2014 compared to February 2013 and 0.9 percent month over month compared to January 2014.
... the forecast indicates that home prices, including distressed sales, are expected to increase 10.5 percent year over year from March 2013 to March 2014.
“As the spring home-buying season kicks off, house price appreciation continues to be strong,” said Dr. Mark Fleming, chief economist for CoreLogic. “Although prices should remain strong in the near term due to a short supply of homes on the market, price increases should moderate over the next year as home equity releases pent-up supply.”
 Click on graph for larger image.
 This graph shows the national CoreLogic HPI data since 1976. January 2000 = 100.
The index was up 0.8% in January, and is up 12.2% over the last year. This index is not seasonally adjusted, so this was a strong month-to-month gain during the "weak" season.
The index is off 16.9% from the peak - and is up 23.5% from the post-bubble low set in February 2012.
 The second graph is from CoreLogic. The year-over-year comparison has been positive for twenty four consecutive months suggesting house prices bottomed early in 2012 on a national basis (the bump in 2010 was related to the tax credit).
I expect the year-over-year increases to slow - and it may show up soon since CoreLogic is forecasting a smaller year-over-year increase for March index.
U.S. Light Vehicle Sales increase to 16.4 million annual rate in March, Highest since 2007
by Calculated Risk on 4/01/2014 03:17:00 PM
Based on an WardsAuto estimate, light vehicle sales were at a 16.38 million SAAR in March. That is up 7.3% from March 2013, and up 7.2% from the sales rate last month.
This was above the consensus forecast of 15.8 million SAAR (seasonally adjusted annual rate).
 Click on graph for larger image.
This graph shows the historical light vehicle sales from the BEA (blue) and an estimate for March (red, light vehicle sales of 16.38 million SAAR from WardsAuto).
Severe weather clearly impacted sales in January and February, and some of the increase in March was probably a bounce back due to better weather.
The second graph shows light vehicle sales since the BEA started keeping data in 1967.
 Note: dashed line is current estimated sales rate.
Unlike residential investment, auto sales bounced back fairly quickly following the recession and were a key driver of the recovery.
Looking forward, the growth rate will slow for auto sales, and most forecasts are for around a small gain in 2014 to around 16.1 million light vehicles.
Construction Spending increased slightly in February
by Calculated Risk on 4/01/2014 11:09:00 AM
The Census Bureau reported that overall construction spending increased in February:
The U.S. Census Bureau of the Department of Commerce announced today that construction spending during February 2014 was estimated at a seasonally adjusted annual rate of $945.7 billion, 0.1 percent above the revised January estimate of $944.6 billion. The February figure is 8.7 percent above the February 2013 estimate of $869.9 billion.Both private and public spending increased slightly in February:
Spending on private construction was at a seasonally adjusted annual rate of $680.0 billion, 0.1 percent above the revised January estimate of $679.1 billion. ...
In February, the estimated seasonally adjusted annual rate of public construction spending was $265.7 billion, 0.1 percent above the revised January estimate of $265.5 billion.
emphasis added
 Click on graph for larger image.
This graph shows private residential and nonresidential construction spending, and public spending, since 1993. Note: nominal dollars, not inflation adjusted.
Private residential spending is 47% below the peak in early 2006, and up 58% from the post-bubble low.
Non-residential spending is 23% below the peak in January 2008, and up about 42% from the recent low.
Public construction spending is now 18% below the peak in March 2009 and up less than 1% from the recent low.
 The second graph shows the year-over-year change in construction spending.
On a year-over-year basis, private residential construction spending is now up 14%. Non-residential spending is up 12% year-over-year. Public spending is down slightly year-over-year.
To repeat a few key themes:
1) Private residential construction is usually the largest category for construction spending, and is now the largest category once again. Usually private residential construction leads the economy, so this is a good sign going forward.
2) Private non-residential construction spending usually lags the economy. There was some increase this time for a couple of years - mostly related to energy and power. Now the key sectors of office, retail and hotels are starting to increase, but from very low levels. As an example, lodging construction spending was up 40% year-over-year, office spending up 19%, and retail spending up 18% year-over-year.
Based on the architecture billings index, I expect private non-residential to increase further this year.
3) Public construction spending was up slightly in February, but is only up 1% from the low in April 2013. It appears that the drag from public construction spending is over. Public spending has declined to 2006 levels (not adjusted for inflation) and was a drag on the economy for 4+ years. In real terms, public construction spending has declined to 2001 levels.
Looking forward, all categories of construction spending should increase in 2014. Residential spending is still very low, non-residential is starting to pickup, and public spending appears to have bottomed.
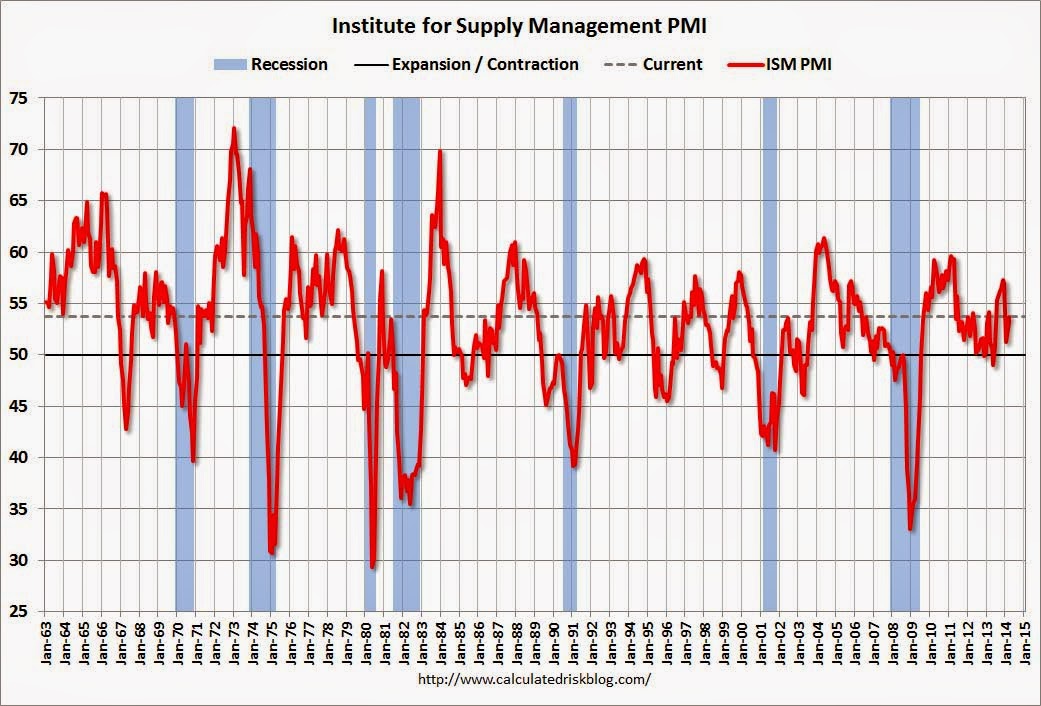
ISM Manufacturing index increased in March to 53.7
by Calculated Risk on 4/01/2014 10:08:00 AM
The ISM manufacturing index indicated faster expansion in March than in February. The PMI was at 53.7% in March, up from 53.2% in February. The employment index was at 51.1%, down from 52.3% in February, and the new orders index was at 55.1%, up from 54.5% in February.
From the Institute for Supply Management: March 2014 Manufacturing ISM Report On Business®
Economic activity in the manufacturing sector expanded in March for the 10th consecutive month, and the overall economy grew for the 58th consecutive month, say the nation's supply executives in the latest Manufacturing ISM® Report On Business®.
The report was issued today by Bradley J. Holcomb, CPSM, CPSD, chair of the Institute for Supply Management® (ISM®) Manufacturing Business Survey Committee. "The March PMI® registered 53.7 percent, an increase of 0.5 percentage point from February's reading of 53.2 percent, indicating expansion in manufacturing for the 10th consecutive month. The New Orders Index registered 55.1 percent, an increase of 0.6 percentage point from February's reading of 54.5 percent. The Production Index registered 55.9 percent, a substantial increase of 7.7 percentage points compared to February's reading of 48.2 percent. Employment grew for the ninth consecutive month, but at a lower rate by 1.2 percentage points, registering 51.1 percent compared to February's reading of 52.3 percent. Several comments from the panel reflect favorable demand and good business conditions, with some lingering concerns about the particularly adverse weather conditions across the country."
emphasis added
 Click on graph for larger image.
Here is a long term graph of the ISM manufacturing index.
This was just below expectations of 54.0%.
Reis: Office Vacancy Rate declined slightly in Q1 to 16.8%
by Calculated Risk on 4/01/2014 09:09:00 AM
Reis released their Q1 2014 Office Vacancy survey this morning. Reis reported that the office vacancy rate declined to 16.8% in Q1. This is down from 16.9% in Q4 2013, and down from the cycle peak of 17.6%.
From Reis Senior Economist Ryan Severino:
The national vacancy rate was down 10 basis points during the fourth quarter to 16.8%. This is a very marginal improvement from last quarter, but completely in line with the tepid recovery in the office sector since it commenced in early 2011. Since that, time declines in vacancy have been no greater than 10 basis points per quarter; the vacancy rate has been unchanged in numerous quarters during the recovery. Over the last twelve months, the vacancy rate is down just 20 basis points, on par with last quarter. National vacancies remain elevated at 430 basis points above the sector's cyclical low of 12.5% recorded during the third quarter of 2007.On absorption and new construction:
emphasis added
Net absorption increased by 9.8 million square feet during the quarter. This is the highest quarterly figure since before the recession. Net absorption averaged roughly 7.1 million square feet per quarter during 2013 so this represents an optimistic start to the year. Construction increased by 6.3 million square feet during the first quarter. This is roughly on par with the quarterly average of 6.5 million square feet during 2013. Therefore, net absorption outpaced completions by approximately 3.5 million square feet during the first quarter. This is heartening because in recent quarters increases in net absorption have been largely tied to increases in construction activity. This is a more organic increase, tied to increasing demand for existing inventory as well as newly completed space.On rents:
Asking and effective rents grew by 0.7% and 0.8%, respectively, during the first quarter. These figures are all little changed from last quarter, owing to the similar tepid pace of improvement in vacancy. Nevertheless, asking and effective rents have now risen for fourteen consecutive quarters, albeit modestly. Asking rent growth was 1.6% during 2011, 1.8% during 2012, and 2.1% in 2013. Given the still‐elevated national vacancy rate, rent growth is struggling to grow faster than inflation because landlords have little leverage over tenants.
 Click on graph for larger image.
This graph shows the office vacancy rate starting in 1980 (prior to 1999 the data is annual).
Reis reported the vacancy rate was unchanged at 16.8% in Q1, and was down from 17.0% in Q1 2013. The vacancy rate peaked in this cycle at 17.6% in Q3 and Q4 2010, and Q1 2011.
Office vacancy data courtesy of Reis.


