by Calculated Risk on 5/02/2013 09:27:00 AM
Thursday, May 02, 2013
Trade Deficit declined in March to $38.8 Billion
The Department of Commerce reported:
[T]otal March exports of $184.3 billion and imports of $223.1 billion resulted in a goods and services deficit of $38.8 billion, down from $43.6 billion in February, revised. March exports were $1.7 billion less than February exports of $186.0 billion. March imports were $6.5 billion less than February imports of $229.6 billion.The trade deficit was lower than the consensus forecast of $42.4 billion.
The first graph shows the monthly U.S. exports and imports in dollars through March 2013.
 Click on graph for larger image.
Exports declined slightly in March, and imports declined even more, so the deficit declined.
Exports are 11% above the pre-recession peak and unchanged compared to March 2012; imports are 4% below the pre-recession peak, and down 6% compared to March 2012.
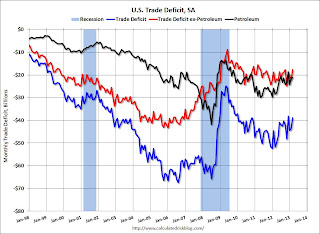
The second graph shows the U.S. trade deficit, with and without petroleum, through March.
 The blue line is the total deficit, and the black line is the petroleum deficit, and the red line is the trade deficit ex-petroleum products.
Oil averaged $96.95 in March, up from $95.96 per barrel in February, but down from $107.95 in March 2012. Oil import prices should start falling in April.
The trade deficit with the euro area was $8.3 billion in March, down slightly from $8.8 billion in March 2012.
The trade deficit with China decreased to $17.9 billion in March, up from $21.7 billion in March 2012. Note: The decline in the trade deficit with China was related to the timing of the Chinese New Year.
Weekly Initial Unemployment Claims decline to 324,000
by Calculated Risk on 5/02/2013 08:30:00 AM
The DOL reports:
In the week ending April 27, the advance figure for seasonally adjusted initial claims was 324,000, a decrease of 18,000 from the previous week's revised figure of 342,000. The 4-week moving average was 342,250, a decrease of 16,000 from the previous week's revised average of 358,250.The previous week was revised up from 339,000.
The following graph shows the 4-week moving average of weekly claims since January 2000.
 Click on graph for larger image.
The dashed line on the graph is the current 4-week average. The four-week average of weekly unemployment claims decreased to 342,250.
Weekly claims were the lowest since 2008, and the 4-week average is just above the low for the year. Claims were below the 345,000 consensus forecast.
Wednesday, May 01, 2013
Thursday: Trade Deficit, Unemployment Claims
by Calculated Risk on 5/01/2013 09:32:00 PM
Last night I was asked if the FOMC would do anything bold today (the statement was released earlier today). I said it was pretty clear that the FOMC would not change policy at this meeting, but they could express more concern about inflation being too low or - if they were really feeling bold - warn about fiscal policy.
On inflation, the FOMC kept the phrase "Inflation has been running somewhat below the Committee's longer-run objective ..." so there wasn't any additional emphasis on inflation.
However, on fiscal policy, the FOMC added the phrase "fiscal policy is restraining economic growth." This was severe criticism of short term deficit cutting.
As we all know, the deficit is declining rapidly (probably too rapidly).
Public employment is down sharply over the last four years, and this morning the Census Bureau reported that public construction spending was at the lowest level since 2001 in real terms (and has declined for four years). Not as much austerity as in Europe, but still too much given the high unemployment rate.
In the short term, U.S. policymakers should not be looking to cut the deficit further, instead they should be focused on unemployment (longer term deficit reduction is a different topic). Eliminating the sequester budget cuts would be good policy since these cuts were an obvious mistake.
As Bernanke noted two months ago, the sequester budget cuts might actually lead to less deficit reduction:
"The CBO estimates that deficit-reduction policies in current law will slow the pace of real GDP growth by about 1-1/2 percentage points this year, relative to what it would have been otherwise.Unfortunately certain policymakers remain impervious to data ...
A significant portion of this effect is related to the automatic spending sequestration that is scheduled to begin on March 1, which, according to the CBO’s estimates, will contribute about 0.6 percentage point to the fiscal drag on economic growth this year. Given the still-moderate underlying pace of economic growth, this additional near-term burden on the recovery is significant.
Moreover, besides having adverse effects on jobs and incomes, a slower recovery would lead to less actual deficit reduction in the short run for any given set of fiscal actions.
Thursday economic releases:
• At 8:30 AM ET: the initial weekly unemployment claims report will be released. The consensus is for claims to increase to 345 thousand from 339 thousand last week.
• Also at 8:30 AM, the Trade Balance report for March from the Census Bureau. The consensus is for the U.S. trade deficit to decrease to $42.4 billion in March from $43.0 billion in February.
Fannie Mae, Freddie Mac: Mortgage Serious Delinquency rates declined in March
by Calculated Risk on 5/01/2013 06:09:00 PM
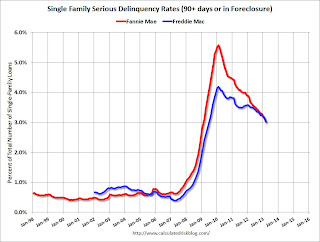
Fannie Mae reported that the Single-Family Serious Delinquency rate declined in March to 3.02% from 3.13% in February. The serious delinquency rate is down from 3.67% in March 2012, and this is the lowest level since February 2009.
The Fannie Mae serious delinquency rate peaked in February 2010 at 5.59%.
Freddie Mac reported that the Single-Family serious delinquency rate declined in March to 3.03% from 3.15% in February. Freddie's rate is down from 3.51% in March 2012, and this is the lowest level since June 2009. Freddie's serious delinquency rate peaked in February 2010 at 4.20%.
Note: These are mortgage loans that are "three monthly payments or more past due or in foreclosure".
 Click on graph for larger image
Although this indicates some progress, the "normal" serious delinquency rate is under 1%.
At the recent rate of improvement, the serious delinquency rate will not be under 1% until 2017 or later.
U.S. Light Vehicle Sales decreased to 14.9 million annual rate in April
by Calculated Risk on 5/01/2013 03:51:00 PM
Based on an estimate from AutoData Corp, light vehicle sales were at a 14.92 million SAAR in April. That is up 6% from April 2012, and down 2% from the sales rate last month.
This was below the consensus forecast of 15.3 million SAAR (seasonally adjusted annual rate).
This graph shows the historical light vehicle sales from the BEA (blue) and an estimate for April (red, light vehicle sales of 14.92 million SAAR from AutoData).
 Click on graph for larger image.
This was the lowest sales rate in six months.
After three consecutive years of double digit auto sales growth, the growth rate will probably slow in 2013 - but this will still be another positive year for the auto industry.
The second graph shows light vehicle sales since the BEA started keeping data in 1967.
 Note: dashed line is current estimated sales rate.
Unlike residential investment, auto sales bounced back fairly quickly following the recession and have been a key driver of the recovery. Looking forward, growth will slow for auto sales. If sales average the recent pace for the entire year, total sales will be up about 5% from 2012.
FOMC Statement: "fiscal policy is restraining economic growth", "prepared to increase or reduce the pace of its purchases"
by Calculated Risk on 5/01/2013 02:00:00 PM
The key changes:
1) "fiscal policy is restraining economic growth."
2) "The Committee is prepared to increase or reduce the pace of its purchases to maintain appropriate policy accommodation as the outlook for the labor market or inflation changes."
The FOMC is clearly signaling that fiscal policy is hurting the economy ...
FOMC Statement:
Information received since the Federal Open Market Committee met in March suggests that economic activity has been expanding at a moderate pace. Labor market conditions have shown some improvement in recent months, on balance, but the unemployment rate remains elevated. Household spending and business fixed investment advanced, and the housing sector has strengthened further, but fiscal policy is restraining economic growth. Inflation has been running somewhat below the Committee's longer-run objective, apart from temporary variations that largely reflect fluctuations in energy prices. Longer-term inflation expectations have remained stable.
Consistent with its statutory mandate, the Committee seeks to foster maximum employment and price stability. The Committee expects that, with appropriate policy accommodation, economic growth will proceed at a moderate pace and the unemployment rate will gradually decline toward levels the Committee judges consistent with its dual mandate. The Committee continues to see downside risks to the economic outlook. The Committee also anticipates that inflation over the medium term likely will run at or below its 2 percent objective.
To support a stronger economic recovery and to help ensure that inflation, over time, is at the rate most consistent with its dual mandate, the Committee decided to continue purchasing additional agency mortgage-backed securities at a pace of $40 billion per month and longer-term Treasury securities at a pace of $45 billion per month. The Committee is maintaining its existing policy of reinvesting principal payments from its holdings of agency debt and agency mortgage-backed securities in agency mortgage-backed securities and of rolling over maturing Treasury securities at auction. Taken together, these actions should maintain downward pressure on longer-term interest rates, support mortgage markets, and help to make broader financial conditions more accommodative.
The Committee will closely monitor incoming information on economic and financial developments in coming months. The Committee will continue its purchases of Treasury and agency mortgage-backed securities, and employ its other policy tools as appropriate, until the outlook for the labor market has improved substantially in a context of price stability. The Committee is prepared to increase or reduce the pace of its purchases to maintain appropriate policy accommodation as the outlook for the labor market or inflation changes. In determining the size, pace, and composition of its asset purchases, the Committee will continue to take appropriate account of the likely efficacy and costs of such purchases as well as the extent of progress toward its economic objectives.
To support continued progress toward maximum employment and price stability, the Committee expects that a highly accommodative stance of monetary policy will remain appropriate for a considerable time after the asset purchase program ends and the economic recovery strengthens. In particular, the Committee decided to keep the target range for the federal funds rate at 0 to 1/4 percent and currently anticipates that this exceptionally low range for the federal funds rate will be appropriate at least as long as the unemployment rate remains above 6-1/2 percent, inflation between one and two years ahead is projected to be no more than a half percentage point above the Committee's 2 percent longer-run goal, and longer-term inflation expectations continue to be well anchored. In determining how long to maintain a highly accommodative stance of monetary policy, the Committee will also consider other information, including additional measures of labor market conditions, indicators of inflation pressures and inflation expectations, and readings on financial developments. When the Committee decides to begin to remove policy accommodation, it will take a balanced approach consistent with its longer-run goals of maximum employment and inflation of 2 percent.
Voting for the FOMC monetary policy action were: Ben S. Bernanke, Chairman; William C. Dudley, Vice Chairman; James Bullard; Elizabeth A. Duke; Charles L. Evans; Jerome H. Powell; Sarah Bloom Raskin; Eric S. Rosengren; Jeremy C. Stein; Daniel K. Tarullo; and Janet L. Yellen. Voting against the action was Esther L. George, who was concerned that the continued high level of monetary accommodation increased the risks of future economic and financial imbalances and, over time, could cause an increase in long-term inflation expectations
Residential Construction Spending increased in March, Non-Residential and Public Spending Decreased
by Calculated Risk on 5/01/2013 11:07:00 AM
The Census Bureau reported that overall construction spending decreased in March:
The U.S. Census Bureau of the Department of Commerce announced today that construction spending during March 2013 was estimated at a seasonally adjusted annual rate of $856.7 billion, 1.7 percent below the revised February estimate of $871.2 billion. The March figure is 4.8 percent above the March 2012 estimate of $817.8 billion.Both private construction and public construction spending decreased (residential increased, non-residential decreased):
Spending on private construction was at a seasonally adjusted annual rate of $598.4 billion, 0.6 percent below the revised February estimate of $602.0 billion. Residential construction was at a seasonally adjusted annual rate of $294.9 billion in March, 0.4 percent above the revised February estimate of $293.8 billion. Nonresidential construction was at a seasonally adjusted annual rate of $303.5 billion in March, 1.5 percent below the revised February estimate of $308.2 billion. ...
In March, the estimated seasonally adjusted annual rate of public construction spending was $258.3 billion, 4.1 percent below the revised February estimate of $269.2 billion.
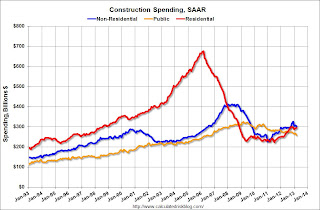
 Click on graph for larger image.
This graph shows private residential and nonresidential construction spending, and public spending, since 1993. Note: nominal dollars, not inflation adjusted.
Private residential spending is 56% below the peak in early 2006, and up 33% from the post-bubble low. Non-residential spending is 27% below the peak in January 2008, and up about 34% from the recent low.
Public construction spending is now 21% below the peak in March 2009 and at the lowest level since 2006 (not inflation adjusted).
 The second graph shows the year-over-year change in construction spending.
On a year-over-year basis, private residential construction spending is now up 18%. Non-residential spending is up 3% year-over-year mostly due to energy spending (power and electric). Public spending is down 5.4% year-over-year.
A few key themes:
1) Private residential construction is usually the largest category for construction spending, but there was a huge collapse in spending following the housing bubble (as expected). Private residential is now about even with private non-residential, and residential will probably be the largest category of construction spending in 2013. Usually private residential construction leads the economy, so this is a good sign going forward.
2) Private non-residential construction spending usually lags the economy. There was some increase this time, mostly related to energy and power - but the key sectors of office, retail and hotels are still at very low levels.
3) Public construction spending has declined to 2006 levels (not adjusted for inflation). This has been a drag on the economy for 4 years. In real terms, this is the lowest level of public construction spending since February 2001.
ISM Manufacturing index declines in April to 50.7
by Calculated Risk on 5/01/2013 10:00:00 AM
The ISM manufacturing index indicated expansion in April. The PMI was at 50.7% in April, down from 51.3% in March. The employment index was at 50.2%, down from 54.2%, and the new orders index was at 52.3%, up from 51.4% in March.
From the Institute for Supply Management: April 2013 Manufacturing ISM Report On Business®
Economic activity in the manufacturing sector expanded in April for the fifth consecutive month, and the overall economy grew for the 47th consecutive month, say the nation's supply executives in the latest Manufacturing ISM Report On Business®.
The report was issued today by Bradley J. Holcomb, CPSM, CPSD, chair of the Institute for Supply Management™ Manufacturing Business Survey Committee. "The PMI™ registered 50.7 percent, a decrease of 0.6 percentage point from March's reading of 51.3 percent, indicating expansion in manufacturing for the fifth consecutive month, but at the lowest rate of the year. The New Orders Index increased in April by 0.9 percentage point to 52.3 percent, and the Production Index increased by 1.3 percentage points to 53.5 percent. The Employment Index registered 50.2 percent, a decrease of 4 percentage points compared to March's reading of 54.2 percent. The Prices Index registered 50 percent, decreasing 4.5 percentage points from March, indicating that overall raw materials prices remained unchanged from last month. Comments from the panel indicate a range of strong/steady growth, to flat/declining volumes, depending upon the particular industry."
 Click on graph for larger image.
Here is a long term graph of the ISM manufacturing index.
This was below expectations of 51.0% and suggests manufacturing expanded at a slower pace in April.
ADP: Private Employment increased 119,000 in April
by Calculated Risk on 5/01/2013 08:20:00 AM
Private sector employment increased by 119,000 jobs from March to April, according to the April ADP National Employment Report®, which is produced by ADP® ... in collaboration with Moody’s Analytics. The report, which is derived from ADP’s actual payroll data, measures the change in total nonfarm private employment each month on a seasonally-adjusted basis. The March report, which reported job gains of 158,000, was revised downward to 131,000 jobs.This was below the consensus forecast for 155,000 private sector jobs added in the ADP report. Note: The BLS reports on Friday, and the consensus is for an increase of 153,000 payroll jobs in April, on a seasonally adjusted (SA) basis.
...
Mark Zandi, chief economist of Moody’s Analytics, said, “Job growth appears to be slowing in response to very significant fiscal headwinds. Tax increases and government spending cuts are beginning to hit the job market. Job growth has slowed across all industries and most significantly among companies that employ between 20 and 499 workers.”
Note: ADP hasn't been very useful in predicting the BLS report.
MBA: Refinance Mortgage Applications Increase, Purchase Applications Decrease
by Calculated Risk on 5/01/2013 07:00:00 AM
From the MBA: Mortgage Refinance Applications Increase in Latest MBA Weekly Survey
The Refinance Index increased 3 percent from the previous week and is at its highest level since the week ending January 18, 2013. The seasonally adjusted Purchase Index decreased 1.4 percent from one week earlier.
...
The HARP share of refinance applications increased from 32 percent last week to 34 percent this week, the highest level since MBA began tracking HARP applications in February 2012.
The average contract interest rate for 30-year fixed-rate mortgages with conforming loan balances ($417,500 or less) decreased to 3.60 percent, the lowest rate since December 2012, from 3.65 percent, with points decreasing to 0.30 from 0.41 (including the origination fee) for 80 percent loan-to-value ratio (LTV) loans.
emphasis added
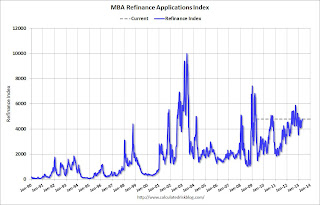
 Click on graph for larger image.
The first graph shows the refinance index.
There has been a sustained refinance boom for over a year.
According to the MBA, the HARP program is contributing significantly to the current level of refis and is at the highest percentage of refinances since the MBA started tracking HARP. Note: HARP is a success story.
 The second graph shows the MBA mortgage purchase index. The 4-week average of the purchase index has generally been trending up over the last year, and even with the slight decline in the weekly index, the 4-week average of the purchase index is at the highest level since May 2010.


