 RSS Feed
 by Calculated Risk on 8/09/2006 04:39:00 PM
Wednesday, August 09, 2006
PIMCO: Housing Made Fed Pause
Today's OC Register has an interview with PIMCO's Paul McCulley: Housing drove Fed
Q. How big a role did a shaky housing market play in Fed's decision?My comments:
A. Huge.
Q. What does this non-action mean for mortgages?
A. Mortgage rates down a touch over last month, likely to hover 'round here, even as "affordable" products (novel home loans containing pay options or negative amortization) abate with tighter underwriting standards and fear.
Q. Should I keep my adjustable mortgage? Is the rising-payment pain over?
A. Yes.
Q. Which is worse for housing: higher rates previously feared or the economic weakness the Fed's sniffing?
A. What's bad for housing is that it has turned, as a result of hikes plus spent speculative forces. Housing is the most reflexive market in the world. Very momentum driven, hard to turn, but once it's turned, it stays turned.
Q. "Soft landing" or disaster ahead for housing?
A. Somewhere in between. How about a "hard-soft landing?"
I'm still trying to find out the timing of the "Nontraditional Mortgage Guidance". I wrote to the FDIC last week, and this was their response:
"The agencies are currently reviewing the comments received and developing final guidance."Not much help.
I'm not sure if McCulley was referring to this new guidance when he mentioned "tighter underwriting standards" or if he thought the industry would react to higher delinquency rates, like LEND reported today:
"Delinquent loans (30 or more days past due, including foreclosures and real estate owned) were 3.76% of the serviced portfolio at June 30, 2006, compared to 2.47% at December 31, 2005 and 1.79% at June 30, 2005."And I'm not sure what a "hard-soft landing" means. Housing will probably land hard with the loss of 15% to 30% or more of all housing related jobs over the next couple of years. How can that be anything but a "hard landing"? Maybe "hard-soft" means hard for housing, but soft for the economy (slow growth, but no recession).
Housing News: TOL and LEND
by Calculated Risk on 8/09/2006 03:00:00 PM
Homebuilder Toll Brothers warned again today. From TheStreet: Toll Trims Estimates Again
Homebuilder Toll Brothers reported a 48% plunge in third-quarter new orders and again cut its delivery forecast for the year, as the company blamed oversupply for the weak U.S. housing market.And subprime mortgage lender, Accredited Homes also warned. Reuters reports: Accredited Home tumbles after slashing outlook
Toll, the country's largest luxury-home builder, also warned that it is walking away from certain land option contracts, which will results in write-offs of deposits. The company said it will quantify this impact when it reports earnings later in August.
...Toll Brothers CEO Robert Toll said the current housing slowdown first manifested last September and is "somewhat unique."
"It is the first downturn in the 40 years since we entered the business that was not precipitated by high interest rates, a weak economy, job losses or other macroeconomic factors," he said.
"Instead, it seems to be the result of an oversupply of inventory and a decline in confidence: Speculative buyers who spurred demand in 2004 and 2005 are now sellers; builders that built speculative homes must now move their specs; and nervous buyers are canceling contracts for homes already under construction. The resulting excess supply has exacerbated the drop in consumer confidence, which first appeared last September, that was already a drag on new-home sales."
The company also said it saw an increase in its cancellation rates in a number of markets, including Orlando, Fla.; Northern California; Palm Springs, Calif.; Las Vegas; and Phoenix.
Accredited Home Lenders Holding Co., a California subprime mortgage lender, slashed its 2006 profit forecast on Wednesday, saying loan volume and net gains on whole loan sales will be lower than expected.And from the Press Release:
Delinquent loans (30 or more days past due, including foreclosures and real estate owned) were 3.76% of the serviced portfolio at June 30, 2006, compared to 2.47% at December 31, 2005 and 1.79% at June 30, 2005.Bad news at the high end (Luxury Homes). Bad news at the low end (Subprime Mortgages).
MBA: Application Volume Increases
by Calculated Risk on 8/09/2006 12:13:00 AM
The Mortgage Bankers Association (MBA) reports: Application Volume Increases 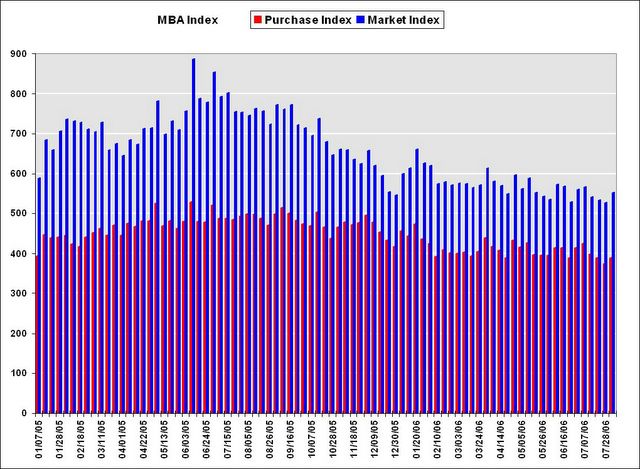
Click on graph for larger image.
The Market Composite Index, a measure of mortgage loan application volume, was 553.3, an increase of 4.9 percent on a seasonally adjusted basis from 527.6 one week earlier. On an unadjusted basis, the Index increased 4.3 percent compared with the previous week but was down 24.9 percent compared with the same week one year earlier.Mortgage rates decreased:
The seasonally-adjusted Purchase Index increased by 3.4 percent to 388.9 from 376.2 the previous week and the Refinance Index increased by 7.1 percent to 1518.1 from 1417.2 one week earlier.
The average contract interest rate for 30-year fixed-rate mortgages decreased to 6.45 percent from 6.62 percent ...Change in mortgage applications from one year ago (from Dow Jones):
The average contract interest rate for one-year ARMs decreased to 5.96 percent from 6.18 percent ...
| Total | -24.9.% |
| Purchase | -21.2% |
| Refi | -30.2% |
| Fixed-Rate | -22.7% |
| ARM | -30.0% |

This graph shows the monthly YoY comparison between 2006 and 2005.
Purchase activity was especially strong in the Summer and early Fall of 2005, and that makes the comparisons look ugly. Still, year-to-date purchase activity is off 12.1% compared to 2005 and appears to be getting worse.
Even though there was a small increase in activity last week, the previous week was the least market activity since May 2002.
Tuesday, August 08, 2006
The Fed and Mortgage Rates
by Calculated Risk on 8/08/2006 05:07:00 PM
For analysis of the Fed's decision to pause, see:
EDIT: FED changed to Fed.
Added: Bloomberg: Pimco's Bill Gross Says Fed Increases Over, Reduction Possible
Econbrowser: Econbrowser (and hopefully Bernanke) gets it right
EconomistView: The Fed Takes a Breather: Target Rate Unchanged at 5.25%
The Big Picture: The Dovish Pause
I'm sure I'll add more links, but I'd like to comment on the impact of the Fed's pause on mortgage rates. For thirty year mortgage rates, the Fed has no direct impact. The thirty year rates mostly follows above the yield of the ten and five year treasury notes:
Click on graph for larger image.
The Fed's pause could mean the economy is weakening, and the yield on the five and ten year notes would then probably fall, followed lower by rates on the thirty year mortgage. In fact, the ten year yield has been falling, and the thirty year rate (as reported by Freddie Mac) has fallen from 6.8% to 6.63% over the last two weeks.
Or, bond investors could revive the "Helicopter Ben" meme (too soft on inflation), and sell-off bonds, increasing the yield. This would then push rates on the thirty year mortgage higher.
Take your pick: both lower and higher fixed rates are possible.
The Fed's decision has a clearer impact on ARMs. Once again, the Fed does not directly impact the ARM rate, but the FED funds rate does set a lower bound for the One Year treasury indexed ARM.
According to Freddie Mac the One Year treasury-indexed ARMs averaged 5.69% last week. With the Fed pausing, the ARM rate will probably fall slightly over the next few weeks - depending on the expectations for future Fed rate hikes. Right now expectations are increasing for another pause in September.
EIA: Impact of Alaskan Shutdown on Oil Prices
by Calculated Risk on 8/08/2006 02:38:00 PM
The EIA reports: Estimates for Oil prices increased $3.00 per barrel
We have raised our forecast for the August 2006 West Texas Intermediate (WTI) crude oil price to $76.50 per barrel, an increase of $3.00 per barrel from our forecast last month. The higher forecast WTI price is a result of the additional pressures we saw in July and a projected reduction in Alaskan oil production following the August 6 announcement by BP oil company that it was temporarily shutting down Alaska’s Prudhoe Bay oil field, which produces about 400 thousand barrels per day (bbl/d) of supplies (about 8 percent of U.S. domestic crude production), after corrosion and a leak were found in a transit pipeline. Petroleum product prices are also expected to be higher in August, particularly on the West Coast where substitute oil supplies will likely require higher transportation and processing costs.The EIA's projections have been consistently too low for the last few years.
 Click on graph for larger image.
As an example, last October (after the hurricanes) the EIA projected WTI prices to flatten out at $64 per barrel for 2006.

The current forecast show prices peaking at around $76.50 per barrel and declining in 2007.
First, I think the impact on prices from the Alaskan shutdown might be greater than currently expected.
But I also think the slowing economy might lead to lower oil prices later this year and in '07 (like the EIA projections).
Here are the EIA comments on Alaska Prudhoe Bay Crude Oil Production Shutdown
On August 6, 2006, BP oil company announced the shutdown of about 400 thousand bbl/d of crude oil production from the Alaskan Prudhoe Bay field because of corrosion discovered in the pipelines that gather crude oil from the producing wells for delivery to the Trans-Alaskan pipeline. While complete estimates of the volume and duration of reduced crude oil production are not yet available and will not likely be for several days, this Outlook assumes that Alaskan crude oil production is reduced by 300 thousand bbl/d from the original expected level in August, 400 thousand bbl/d in September and October, 300 thousand bbl/d in November, 200 thousand bbl/d in December, and 100 thousand bbl/d in January, then returning to full production. This production outage forecast is based on BP’s initial estimate that the shutdown would last “several” months. Our forecast could change as new information becomes available.
The greatest impact of the lowered Alaskan crude oil production is on the West Coast, which consumes almost all of the Alaskan oil production. West Coast refineries process about 2.7 million bbl/d of crude oil and Alaska was expected to supply about 800 thousand bbl/d to these refineries. The reduction in Alaska crude oil supply from the shut-in of Prudhoe Bay production can be made up for in several ways: drawdown of crude oil or product stocks and substitution of other supplies for the Alaskan crude oil.
Some of the lost Alaskan oil production will be made up from inventories. Crude oil stocks on the West Coast at the end of July were almost 5.5 million barrels higher than July last year and U.S. crude oil stocks were over 15 million barrels higher. Similarly, gasoline and distillate fuel product inventories are above last year’s levels for the U.S. (5.7 and 5.3 million barrels, respectively) and on the West Coast (1.4 and 1.9 million barrels, respectively). The Strategic Petroleum Reserve (SPR), which currently holds about 688 million barrels of crude oil, may also serve as a source of crude oil supply from inventory.
EIA currently estimates that 1.1 to 1.3 million bbl/d of crude oil spare production capacity is available, mostly in Saudi Arabia. Since West Coast (PADD 5) refinery configurations are complex enough to handle various crude qualities, substitutes for Alaskan crude oil are available. Incremental production from Saudi Arabia as well as diverted shipments of crude oil from Ecuador, Colombia, and Mexico can offset all or part of the shortfall.
Monday, August 07, 2006
Roubini: Recession Odds Now 70%
by Calculated Risk on 8/07/2006 09:00:00 PM
Professor Roubini is becoming even more pessimistic: Four Investors' Fairy Tales...and Five Ugly Realities About the Coming Severe U.S. Recession.
Sunday, August 06, 2006
Impact of Alaskan Oil Shut Down
by Calculated Risk on 8/06/2006 10:18:00 PM
The AP reports: Major Alaskan oil field shutting down
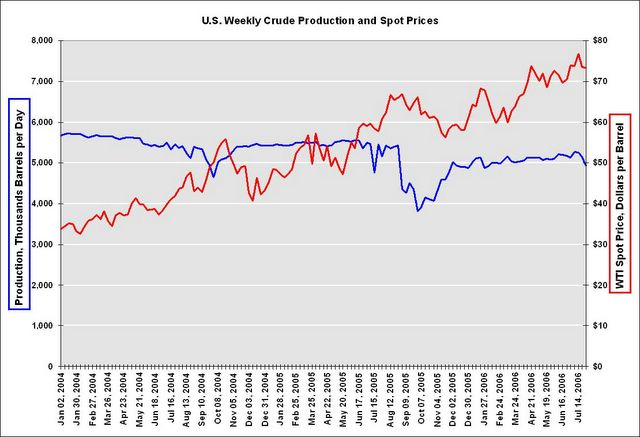
Half the oil production on Alaska's North Slope was being shut down Sunday after BP Exploration Alaska, Inc. discovered severe corrosion and a small spill from a Prudhoe Bay oil transit line.The reduction in crude oil production is similar in quantity to the impact from Hurricane Ivan in September 2004. The 400K barrels per day is much less than the loss from Katrina and Rita in 2005. However the duration of the Alaskan shutdown is unknown, and that is concerning.
BP officials said they didn't know how long the Prudhoe Bay field would be off line. "I don't even know how long it's going to take to shut it down," said Tom Williams, BP's senior tax and royalty counsel.
Once the field is shut down, in a process expected to take day, BP said oil production will be reduced by 400,000 barrels a day. That's close to 8 percent of U.S. oil production as of May 2006, according to data from the U.S. Energy Information Administration.
Click on graph for larger image.
This graph shows domestic production and spot prices for the last 3 years. The impact of the hurricanes on production is clear (Ivan in 2004, Katrina and Rita in 2005).
Based on the previous disruptions to crude production, I'd expect something like a $5 per barrel increase in the spot price of crude oil ($80 Oil). For gasoline, the West Coast might see a significant price increase.
Friday, August 04, 2006
July Employment Report
by Calculated Risk on 8/04/2006 10:02:00 AM
MarketWatch reports: U.S. nonfarm payrolls rise 113,000 in July
The U.S. economy added fewer-than-expected nonfarm jobs in July and the unemployment rate rose to its highest level since February, the Labor Department said on Friday ...
U.S. nonfarm payrolls climbed by 113,000 in July after a revised 124,000 gain in June and the unemployment rate rose to 4.8% in July from June's 4.6%.
 Click on graph for larger image.
Here is the cumulative nonfarm job growth for Bush's 2nd term. The gray area represents the expected job growth (from 6 million to 10 million jobs over the four year term). Job growth is about in the middle of the expected range.
The following two graphs are the areas I've been watching closely: residential construction and retail employment.

Residential construction employment decreased by 9,000 jobs in July and is now down about 1% from the peak in February.
Note the scale doesn't start from zero: this is to better show the change in employment.
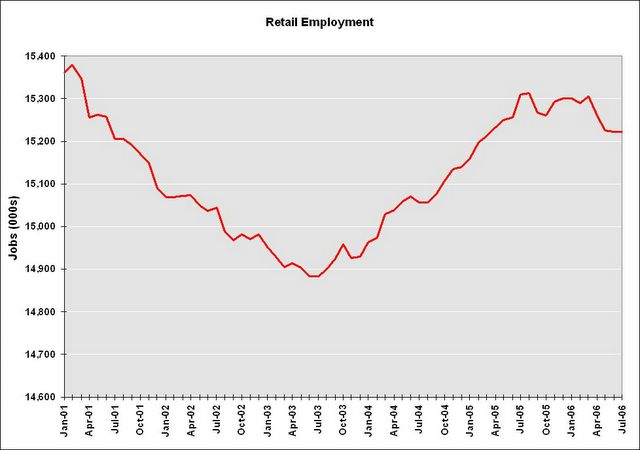
Retail employment was flat in July after 3 months of slight declines. The YoY change in retail employment is now -0.5%. As Jan Hatzius noted:
"Year-on-year declines in retail employment are unprecedented outside of recessions."
Thursday, August 03, 2006
Recession Predictions
by Calculated Risk on 8/03/2006 03:33:00 PM
Last week, Professor Roubini predicted a recession later this year or early in '07:
"There will be no soft landing; it will be as hard a landing as it gets."And models using the yield curve are estimating about a 41% chance of recession in the next six months: See Political Calculations.
Now comes Dr. Delong: The odds of economic meltdown
Forecasting recessions is a fool's game. If there is enough solid economic information to make it appear highly likely that a recession is coming -- that production, employment and consumer demand will actually fall -- then it is highly likely that there already is a recession. Businesses are not stupid, and they don't have to wait for economists to tell them what they already know. By the time a gloomy forecast has been issued they've probably already noticed a drop in consumer demand and responded by firing workers and reducing production.And Professor DeLong concludes:
So: Never say that a recession is coming. Say only that a recession is here, or that there might be a recession on the way. Which, in fact, is what I'm saying today. As of the beginning of August 2006, a recession is not here, and I'm not going to violate my own rule by saying one is coming. But there is a good chance -- for the first time since 2003 -- that there might be a recession in progress six months from now.
Why? Three factors: 1) A Federal Reserve that finds itself with less inflation-fighting credibility than it thought it had; 2) upward pressure on inflation from rising energy and, perhaps, import prices; and 3) millions of middle-class homeowners who for too long have treated their houses as gigantic ATMs, using home equity loans and refinancing to generate extra spending money.
Make no mistake about it: The U.S. economy is close to the edge. Retail sales in the second quarter were rising at only a 2.1 percent annual pace. Business investment in equipment and software was falling. Residential construction was falling. Either households will continue spending beyond all reason, or businesses will start boosting investment, or exports will start booming, or there will be a recession sometime in the next year. Figure the odds at 3 out of 10.
California Housing: Default Notices vs. Price
by Calculated Risk on 8/03/2006 11:08:00 AM
In the previous post, DataQuick reported that default notices for Q2 2006 had reached a three year high in California. The following graph compares the annual number of default notices sent in California since 1992 (start of DataQuick data series) and house prices.
Notes: Price is from the OFHEO series for California (100 = Q1 1990). This is the price peak for the previous bust. 2006 is estimated for both series: Price is estimated at a 4% annual increase and default notices are double the reported notices sent for the first two quarters of 2006.
Click on graph for larger image.
During the previous bust, as prices slowly fell over 6+ years, the number of default notices continued to rise. Finally, in 1997, as housing prices started to rise and the number of default notices declined.
There is probably a vicious cycle that lasts several years during a housing bust: as prices fall, homeowners in distress can't sell and find themselves in default. And, as more homes go into foreclosure, prices fall some more.
It appears this vicious cycle is just starting for the current housing bust.


