 RSS Feed
 by Calculated Risk on 3/31/2005 11:07:00 PM
Thursday, March 31, 2005
Mortgage Rates Continue Climb
According to the FreddieMac weekly survey, 30 year fixed rate mortgages averaged 6.04% last week with 0.7 points. Also:
"Five-Year Treasury-indexed hybrid adjustable-rate mortgages (ARMs) averaged 5.43 percent this week, with an average 0.7 points, up from 5.35 last week. There is no annual historical information for last year since Freddie Mac only began tracking this mortgage rate at the start of this year.I would like to point out some quotes from this article "Higher rates dampen home ownership dreams in Bay Area" (hat tip to Ben at thehousingbubble for pointing this out):
One-year Treasury-indexed adjustable-rate mortgages (ARMs) averaged 4.33 percent this week, with an average 0.8 point, up from last week when it averaged 4.24 percent. At this time last year, the one-year ARM averaged 3.46 percent."
In the first two months of 2005, 82 percent of people who bought homes in the nine Bay Area counties and Santa Cruz County got adjustable-rate mortgages, according to DataQuick Information Systems. But buyers who chose a one-year adjustable last year could be facing payment shocks when their loans adjust for the first time this year, [Greg McBride, a senior financial analyst at Bankrate.com] said.First, it is important to note that 82% of buyers in the Bay Area used ARMs! So this is a relevant calculation.
Last spring, a buyer with a $450,000 loan at 3.47 percent had a monthly payment of $2,013.17. This year, with the increase capped at a typical two percentage points, the rate would be 5.47 percent, and the monthly payment would be $2,531.76.
"And you're not done," McBride said, "because this time next year it's likely to adjust again."
Next, we could do a similar calculation with the current rate. An ARM based on the one year treasury is 4.33% (the one year last week was yielding 3.4%). If someone took out a $450,000 loan this week, their monthly payment would be: $2234.86. If the loan increased the maximum, their payments next year would be $2794.18. Ouch!
But there is another interesting calculation. I've seen several analysts arguing that home prices are fundamentally correct assuming buyers only consider their monthly payment when purchasing a house (as opposed to other fundamentals, like replacement cost or buy vs. rent). If we assume $50K down and a $450K loan, a house that was worth $500K last year should only be worth $455K this year - a 9% price decline.
Of course prices of homes in the Bay Area have increased 12% (according to OFHEO) in the San Francisco, San Mateo, and Redwood area last year. Based on this "payment" approach to value, if homes were fairly valued last year, they are now overvalued by about 20%.
Buying GDP Growth with Debt
by Calculated Risk on 3/31/2005 12:43:00 AM
The final fourth quarter GDP numbers were released by the Commerce Department. The headline number was 3.8% annualized GDP growth in the 4th quarter of 2004. That is solid growth and about average for the last 10 years.
However, the growth in the National Debt and household mortgage debt in the 4th quarter, as a percentage of GDP, is the untold story. Here are the numbers for the 4th quarter, 2004:
GDP: $2.999 Trillion ($11.994 Trillion annual rate)
Increase in National Debt: $217 Billion (US Treasury)
Increase in Mortgage Debt: $205 Billion (Federal Reserve: Flow of Funds)
The increase in National and household mortgage debt as % of GDP: 14.1%
This continues a trend over the last four years as depicted in this chart. It appears that we are buying GDP growth with debt. If I was analyzing a company's balance sheet, and I saw this trend, I would be very concerned.
And the 4th quarter was even worse. The increase in debt was 14.1% of GDP.
With all that additional debt, maybe we should be asking why GDP growth was so low!
Wednesday, March 30, 2005
The Thirty Year Hamburger
by Calculated Risk on 3/30/2005 04:29:00 PM
Mortgage defaults are on the rise in Denver. This story says that "soaring foreclosure filings in Arapahoe County for the first three months of this year helped drive metro Denver's foreclosure rate 34 percent higher than the same period of last year and 30 percent higher than the fourth quarter of 2004."
Some interesting quotes:
"Lenders started giving money to people, and it's gotten out of hand," said Jeannie Reeser, public trustee of Adams County. "I am talking to people who have jobs, but their income doesn't come anywhere close to matching their financing."But this post is about hamburgers. And not just any hamburgers; 30 year hamburgers! At the end of the Post article was this comment:
"I am not in a position to say it's faulty lending, but we have too many foreclosures that are on brand-new loans not to conclude that something is wrong," [ said Arapahoe County Public Trustee Mary Wenke].
"Credit is so loose today that I can buy the groceries I need on a credit card, eat the food tonight, discard the food by tomorrow at noon and finance my debt on a 30-year, amortized loan. How stupid is that? But people do it all the time - and then they wonder why they're in foreclosure."The recipe for a 30 year hamburger:
1) Go to your fast food restaurant.
2) Buy a hamburger on your credit card.
3) Refinance your house and payoff your credit debt with a 30-year loan.
I hope it was a great hamburger!
Monday, March 28, 2005
AEI: Greenspan's Second Bubble
by Calculated Risk on 3/28/2005 11:10:00 PM
Even the conservative think tank, American Enterprise Institute, is opining about the housing bubble. AEI Economist John Makin both excuses and blames Greenspan for the bubble.
"Like so many difficult issues, the housing bubble has emerged from an unusual combination of events. The Fed’s response to each is defensible. However, taken collectively, those responses have encouraged what is arguably a worldwide housing bubble."Very interesting.
Recession Predictions: A Mug's Game?
by Calculated Risk on 3/28/2005 11:59:00 AM
"It's hard to make predictions - especially about the future."
Allan Lamport, former Toronto Mayor.
UPDATE: Two people have commented that the above quote was from Yogi Berra. It definitely sounds like Berra, and it is usually attributed to Berra, but I'm pretty sure it is from Mayor Lamport.
I’m going to take a look at the last consumer recession (July 1990 to March 1991) for clues about what to look for in the current situation. I believe the next recession will be consumer driven, led by a slow down in real estate, perhaps triggered by high energy prices and rising interest rates.
First, I would like to point out that forecasters have a terrible record at predicting downturns. Victor Zarnowitz wrote that major "...failures of forecasting are related to the incidence of slowdowns and contractions in general economic activity. Forecasts...go seriously wrong when such setbacks occur." The reason for this predictive failure is primarily due to the forecasters' incentives. Zarnowitz wrote: "predicting a general downturn is always unpopular and predicting it prematurely—ahead of others—may prove quite costly to the forecaster and his customers".
Incentives motivate economic forecasters to always be optimistic about the future (just like stock analysts). Luckily I have no customers (my thoughts are free and worth every penny), no financial incentives and no reputation! That said, I’m not predicting a recession (yet), only suggesting tools that might help identify the next recession.
The 1990/1991 Recession
As we look back at the ’90 recession, here are a few quotes from Fed Chairman Alan Greenspan (bear in mind that the recession started in July, 1990):
“In the very near term there’s little evidence that I can see to suggest the economy is tilting over [into recession].” Greenspan, July 1990
“...those who argue that we are already in a recession I think are reasonably certain to be wrong.” Greenspan, August 1990
“... the economy has not yet slipped into recession.” Greenspan, October 1990Source (pdf): "Booms, Busts, and the Role of the Federal Reserve" by David Altig (See macroblog)
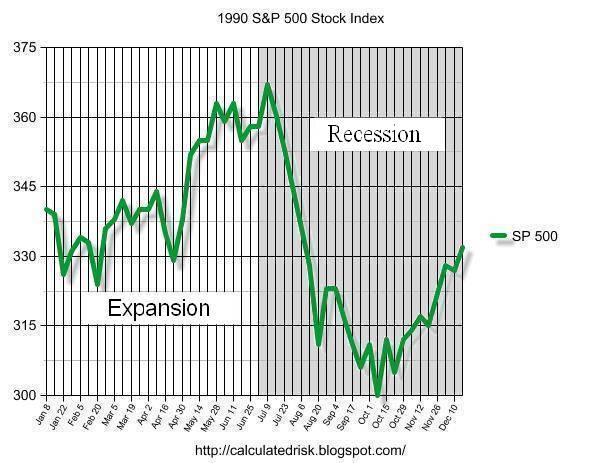
A common belief is that the stock market predicts economic activity. Looking back at 1990, here is a graph of the S&P 500. The graph shows that the market rallied right into the recession and only started selling off after the recession started.
Click on graph for larger image.
Another coincident indicator in 1990 was employment.

This graph shows monthly job creation in 1990. Although job creation was spotty for a couple of months before the recession, it didn’t turn negative until after the recession started.
A potentially predictive tool, often cited by investors, is an inverted yield curve. An inverted yield curve exists when the rates on shorter duration instruments are higher than rates on longer duration instruments. Here are the yields for the 13 week treasury note, and 5 year and 10 year treasury bills.

The curve inverted in mid-1989, a full year before the recession started. A popular joke on Wall Street at the time was that the yield curve has predicted eleven of the last 7 recessions! The yield between the 5 year and 10 year did stay narrow right up to the recession. I'm not sure why the bond market would have more information than the stock market, but this indicator is frequently cited.
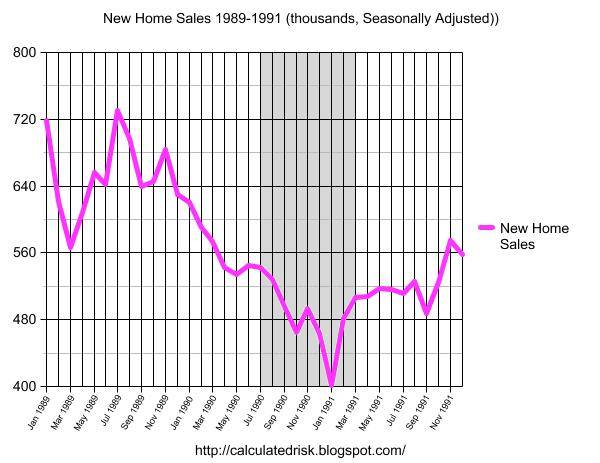
The last chart is my favorite leading indicator: New Home Sales. As the chart indicates, New Home Sales were declining for 12 months prior to the start of the recession. This has been observed (usually 8 to 12 months) for other consumer recessions (see New Home Sales as Leading Indicator and Update).
It makes sense that consumers, sensing economic weakness, would pull back on large purchases first (like homes). Then, since the Real Estate market is a large percentage of the U.S. economy, a slow down in Real Estate acts as a drag on the general economy - perhaps a self-fulfilling prophecy.
The Current Situation
So what does this mean for today?

First, here is the current chart for the 13 week treasury note, and 5 year and 10 year treasury bills. Clearly interest rates are rising, but the chart also shows that the yield curve is narrowing. The spread between the five and down year bills is close to 30 bps.

And finally, here is the current chart for New Home Sales. It is possible that New Home Sales peaked last October, however February's data was still very strong.
So, for now, I do not believe a recession is imminent. I'm just starting to watch for the early signs. Predicting recessions may be a mug's game, but I'm probably going to play.
Price-Rent Ratio: USA and San Diego
by Calculated Risk on 3/28/2005 03:19:00 AM
I posted a Price-Rent ratio for the US on Angry Bear:"Housing: Speculation and the Price-Rent Ratio". The following is the same calculation for San Diego (one of the hottest RE markets).
Click on graph for larger image.
The price component is from the OFHEO home price index for San Diego-Carlsbad-San Marcos and the rent series is from the BLS San Diego owner’s equivalent rent index.
Obviously San Diego has seen more recent appreciation. San Diego also experiences more volatility, but that is expected since the US is an average of many areas.
More on Housing Speculation
by Calculated Risk on 3/28/2005 01:13:00 AM
My most recent post is up on Angry Bear: Housing: Speculation and the Price-Rent Ratio
For a running list of News links on housing, see Patrick's Housing Crash site.
For an interesting graph and some great quotes, see Mish's "It's a Totally New Paradigm".
UPDATE: Another interesting article quoting Merrill Lynch chief economist David Rosenberg and Dean Baker, co-director of the Center for Economic & Policy Research: Bubble in housing will burst
Best to all.
Friday, March 25, 2005
Free Money!
by Calculated Risk on 3/25/2005 03:45:00 PM
Come and get it. Price doesn't matter. Interest rates don't matter. They're giving away free money, right here in Orange County, California. Just buy a home, wait a year, and put the cash in your pocket!
At least that was my reaction to this story in the OC Register: "Loan rates on the rise". The story quotes Gary Watts, a Mission Viejo "real-estate broker and economist" as expressing
... his enthusiasm this way: The recent $100 increase in monthly payments - or $1,200 a year - is nothing compared to what he predicts is Orange County home-price appreciation potential: as much as $70,000 a year.A simple calculation: The median home price in OC is $555,000. With 10% down, a buyer's monthly payment for P&I would be $2997.97 (plus property taxes of about $500 /month). This is based on a 30 year fixed rate loan at 6.01% (see FreddieMac)
"There's too much emphasis on interest rates in the marketplace," Watts said. "Who wouldn't trade $1,200 for $70,000?"
By my calculation, a speculator's first year risk is: $41.5K + their $55.5K down payment = $97K (minus the utility of the property), not $1200. Of course, with a 1 Year ARM (currently 4.24%) a speculator is only risking $35K + $55.5K = $90.5K (minus utility). And if the speculator can obtain a no money down loan, they are only risking the monthly payments minus the net rental income (or other utility if they occupy the house).
And what is the likelihood that houses in OC will appreciate $70K over the next year? Is there always a greater fool?
Thursday, March 24, 2005
New Home Sales Rebound in February
by Calculated Risk on 3/24/2005 10:38:00 AM
According to a Census Bureau report, New Home Sales rebounded in February to a seasonally adjust annual rate of 1.126 million.
Sales of new one-family houses in February 2005 were at a seasonally adjusted annual rate of 1,226,000, according to estimates released jointly today by the U.S. Census Bureau and the Department of Housing and Urban Development. This is 9.4 percent (±14.7%)* above the revised January rate of 1,121,000 and is 5.2 percent (±13.3%)* above the February 2004 estimate of 1,165,000.
The median sales price of new houses sold in February 2005 was $230,700; the average sales price was $288,400. The seasonally adjusted estimate of new houses for sale at the end of February was 444,000. This represents a supply of 4.4 months at the current sales rate.
Click on Graph for larger image.
The New Home Sales report shows no sign of a slowdown.
Wednesday, March 23, 2005
Refinance Applications Down 60% from Last Year
by Calculated Risk on 3/23/2005 07:06:00 PM
Mortgage applications were down 9.5% last week according to the Mortgage Bankers Association (MBA). According to their press release:
The Market Composite Index - a measure of mortgage loan application volume - was 658.8, an decrease of 9.5 percent on a seasonally adjusted basis from 727.6 one week earlier. On an unadjusted basis, the Index decreased 9.2 percent compared with last week but was down 39.3 percent compared with the same week one year earlier.My emphasis added. Is this the beginning of the end of mortgage equity extraction?
"The increase in mortgage rates has reduced application activity across the board, particularly for refinances. Refinance applications are down more than 60 percent relative to this time last year," said Michael Fratantoni, MBA's senior director of single family research and economics.


