The key reports this week are the advance estimate of Q2 GDP and the July employment report.
Other key reports include May Case-Shiller house prices, July ISM manufacturing index and July vehicle sales.
The FOMC meets this week and no change to the Fed Funds rate is expected.
----- Monday, July 28th -----
10:00 AM: the
Q2 2025 Housing Vacancies and Homeownership from the Census Bureau.
10:30 AM:
Dallas Fed Survey of Manufacturing Activity for July.
----- Tuesday, July 29th -----

9:00 AM:
S&P/Case-Shiller House Price Index for May.
This graph shows the year-over-year change in the seasonally adjusted National Index, Composite 10 and Composite 20 indexes through the most recent report (the Composite 20 was started in January 2000).
The consensus is for a 2.5% year-over-year increase in the Comp 20 index for May.
9:00 AM:
FHFA House Price Index for May. This was originally a GSE only repeat sales, however there is also an expanded index.
10:00 AM ET:
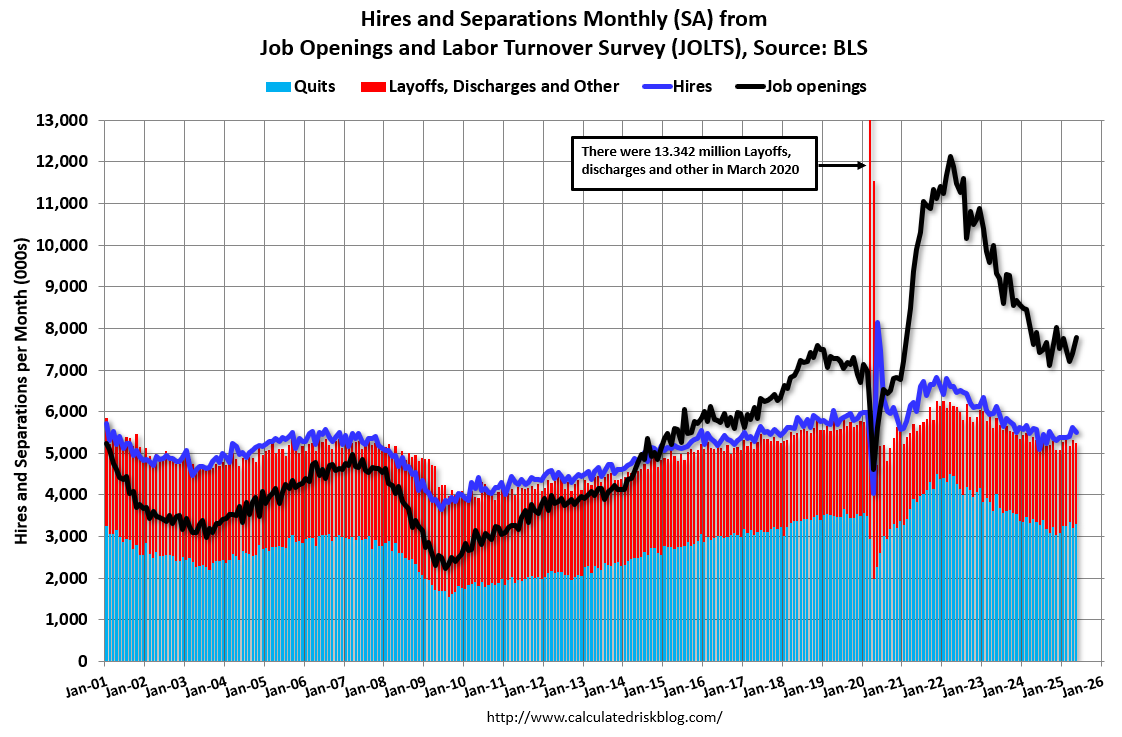
Job Openings and Labor Turnover Survey for June from the BLS.
This graph shows job openings (yellow line), hires (purple), Layoff, Discharges and other (red column), and Quits (light blue column) from the JOLTS.
Jobs openings increased in May to 7.77 million from 7.40 million in April.
The number of job openings (yellow) were down 2% year-over-year and Quits were down 2% year-over-year.
----- Wednesday, July 30th -----
7:00 AM ET: The Mortgage Bankers Association (MBA) will release the results for the
mortgage purchase applications index.
8:15 AM: The
ADP Employment Report for June. This report is for private payrolls only (no government). The consensus is for 75,000 payroll jobs added in June, up from -33,000 in May.
8:30 AM:
Gross Domestic Product, 2nd quarter (advance estimate), and annual update. The consensus is that real GDP increased 2.5% annualized in Q2, up from -0.5% in Q1.
10:00 AM:
Pending Home Sales Index for June. The consensus is for a 0.3% increase in the index.
2:00 PM:
FOMC Meeting Announcement. No change to the Fed Funds rate is expected.
2:30 PM:
Fed Chair Jerome Powell holds a press briefing following the FOMC announcement.
----- Thursday, July 31st -----
8:30 AM: The
initial weekly unemployment claims report will be released. The consensus is for initial claims to increase to 220 thousand from 217 thousand last week.
8:30 AM ET:
Personal Income and Outlays, June 2025. The consensus is for a 0.3% increase in personal income, and for a 0.4% increase in personal spending. And for the Core PCE price index to increase 0.3%. PCE prices are expected to be up 2.5% YoY, and core PCE prices up 2.7% YoY.
9:45 AM:
Chicago Purchasing Managers Index for July.
----- Friday, August 1st -----

8:30 AM:
Employment Report for July. The consensus is for 118,000 jobs added, and for the unemployment rate to increase to 4.2%.
There were 147,000 jobs added in June, and the unemployment rate was at 4.1%.
This graph shows the jobs added per month since January 2021.
10:00 AM:
ISM Manufacturing Index for July. The consensus is for the ISM to be at 49.8, up from 49.0 in June.
10:00 AM:
Construction Spending for June. The consensus is for a 0.1% increase in construction spending.
10:00 AM:
University of Michigan's Consumer sentiment index (Final for July).

Late:
Light vehicle sales for July from the BEA. The consensus is for light vehicle sales to be 16.2 million SAAR in July, up from 15.3 million in June (Seasonally Adjusted Annual Rate).
This graph shows light vehicle sales since the BEA started keeping data in 1967. The dashed line is the sales rate for last month.
 Note: Mortgage rates are from MortgageNewsDaily.com and are for top tier scenarios.