 RSS Feed
 by Calculated Risk on 5/21/2021 11:25:00 AM
Friday, May 21, 2021
Comments on April Existing Home Sales
Earlier: NAR: Existing-Home Sales Decreased to 5.85 million in April
A few key points:
1) This was the highest sales rate for April since 2006, and the 4th highest sales rate for April on record (behind 2004, 2005, and 2006). Some of the increase over the last ten months was probably related to record low mortgage rates, a move away from multi-family rentals, strong second home buying (to escape the high-density cities), a strong stock market and favorable demographics.
Also, the delay in the 2020 buying season pushed the seasonally adjusted number to very high levels over the winter. This means there are going to be some difficult comparisons in the second half of 2021!
2) Inventory is very low, and was down 20.5% year-over-year (YoY) in April. Also, as housing economist Tom Lawler has noted, the local MLS data shows even a larger decline in active inventory (the NAR appears to include some pending sales in inventory). Lawler noted:
"As I’ve noted before, the inventory measure in most publicly-released local realtor/MLS reports excludes listings with pending contracts, but that is not the case for many of the reports sent to the NAR (referred to as the “NAR Report!”), Since the middle of last Spring inventory measures excluding pending listings have fallen much more sharply than inventory measures including such listings, and this latter inventory measure understates the decline in the effective inventory of homes for sale over the last several months."
It seems likely that active inventory is down close to 50% year-over-year.
3) As usual, housing economist Tom Lawler's forecast was closer to the NAR report than the Consensus. The NAR reported 5.85 million SAAR, Lawler estimated the NAR would report 5.96 million SAAR, and the consensus was 6.09 million SAAR.
 Click on graph for larger image.
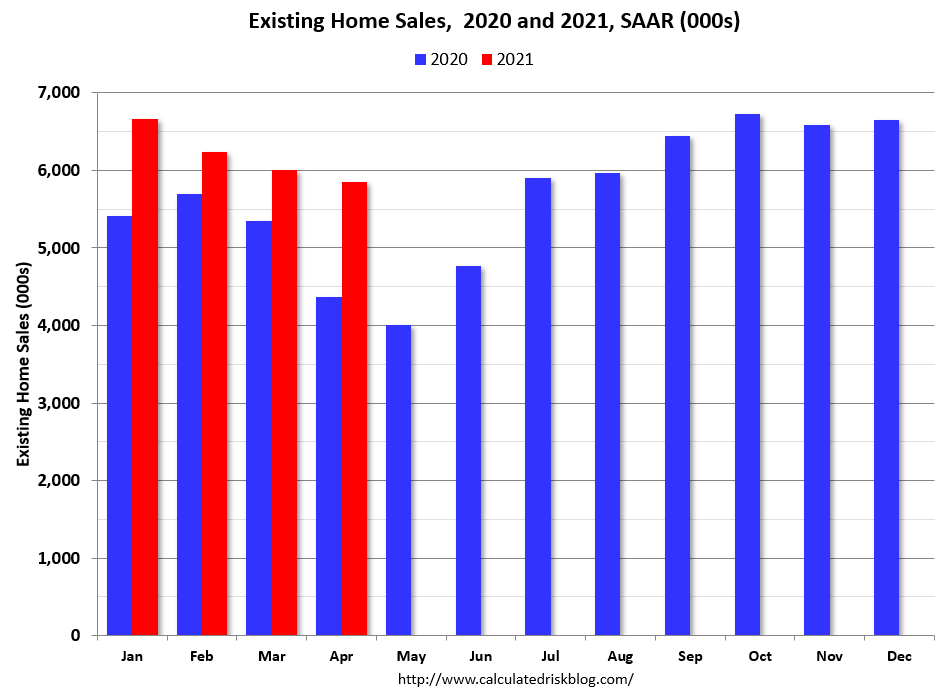
This graph shows existing home sales by month for 2020 and 2021.
The year-over-year comparisons will be easy in May and June, and then difficult in the second half of the year.
The second graph shows existing home sales for each month, Not Seasonally Adjusted (NSA), since 2005.
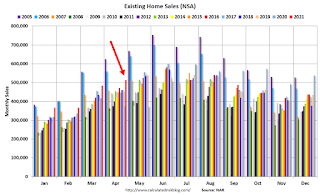 Sales NSA in April (513,000) were 37.5% above sales last year in April (373,000).
This was the highest sales for April (NSA) since 2006.
 Click on graph for larger image.
This graph shows existing home sales by month for 2020 and 2021.
The year-over-year comparisons will be easy in May and June, and then difficult in the second half of the year.
The second graph shows existing home sales for each month, Not Seasonally Adjusted (NSA), since 2005.
 Sales NSA in April (513,000) were 37.5% above sales last year in April (373,000).
This was the highest sales for April (NSA) since 2006.


