by Calculated Risk on 8/20/2018 08:19:00 AM
Monday, August 20, 2018
A few comments on the Labor Force Participation Rate
Last week an article misrepresented my writings on the Labor Force Participation Rate (not a big deal, this happens). But this gives me an excuse to post a few graphs and discuss the likely path of the labor force participation rate (LFPR) over time.
Back around 2010 and 2011, when the unemployment rate started falling, following the great recession, a number of observers claimed that the decline in the unemployment rate wasn't a real improvement in the labor market, and that the decline was mainly because of the decline in the participation rate. I had the opposite view. For example, in 2012 I wrote:
"Bottom line: If someone says the "actual" unemployment rate is much higher than reported because of the decline in the participation rate, they are unaware of a key demographic shift."And also in 2012 I wrote:
"Any bounceback in the participation rate as the economy recovers will probably be fairly small, and that the decline in the overall participation rate is mostly due to demographic factors."
 Click on graph for larger image.
This graph show the overall labor force participation rate over time (the red arrow points to approximately when I made the above two comments). The LFPR continued to decline for a couple more years, and then moved mostly sideways over the last 5 years.
A key point: Those expecting the LFPR to bounce back to prerecession highs were mistaken.
Because of the demographics impact, and the impact of some long term trends (more people going to college is an example), I recommended using the LFPR for those "25 to 54 years old". I post this every month after the employment report is released.
Note: The reason everyone uses this age group (aka "Prime age group"), is the BLS puts out data every month for this group. If we looked at say "25 to 59" or "25 to 64", we'd have to do a little more work (I've done this, but mostly I stick with the 25 to 54 group).
 Here is the participation rate and employment-population ratio for this key working age group: 25 to 54 years old.
In the earlier period the participation rate for this group was trending up as women joined the labor force. Since the early '90s, the participation rate moved more sideways, with a downward drift starting around '00 - and with ups and downs related to the business cycle.
With more younger workers (and fewer 50+ age workers), the prime participation rate might move up some more. The employment population ratio is almost back to the pre-great recession highs.
This is why I've recommended using this graph (not perfect, but more useful than the overall participation rate).
So what will happen to the overall participation rate going forward?
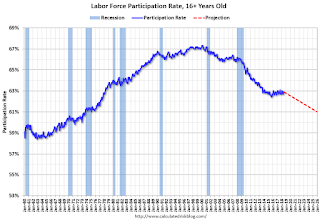
The BLS estimates that the LFPR will decline to around 61% in 2026 from the current level of 62.9%. See T. Alan Lacey, Mitra Toossi, Kevin S. Dubina, and Andrea B. Gensler, "Projections overview and highlights, 2016–26," Monthly Labor Review, U.S. Bureau of Labor Statistics, October 2017. There will probably be an update to these projections soon.
 This graph shows the LFPR and a projection to 2026 (some other projections show the LFPR declining even more over the next decade). Note: I drew a straight line from today to the 2026 projection - it is possible that the LFPR will move sideways before starting to decline - but the rate will eventually decline further.
I'll post some more details soon. But the bottom line is the overall LFPR has declined due to demographics and some long term trends - and will decline further - and that the "prime age" LFPR is more useful for observing the recovery.
Here are a few of my posts on the LFPR over the years (this is a small sample):
• Why the Prime Labor Force Participation Rate has Declined
• Understanding the Decline in the Participation Rate
• Employment: A decline in the participation rate was expected due to the aging population
• Comments on the Employment-Population Ratio
• Labor Force Participation Rate Projection Update
• The Declining Participation Rate


