by Calculated Risk on 8/06/2014 12:11:00 PM
Wednesday, August 06, 2014
U.S. Births increased in 2013 after Declining for Five Consecutive Years
This provisional data for 2013 was released in May and shows a possible impact of the great recession ...
From the National Center for Health Statistics: Births: Preliminary Data for 2013. The NCHS reports:
The 2013 preliminary number of U.S. births was 3,957,577, slightly more (4,736) than in 2012. ...The most amazing data is on teen births (see 2nd graph below).
The general fertility rate was 62.9 births per 1,000 women aged 15–44, down slightly from 2012 and a record low.
Here is a long term graph of annual U.S. births through 2013 ...
 Click on graph for larger image.
Births had declined for five consecutive years, and are about 8.3% below the peak in 2007 (births in 2007 were at the all time high - even higher than during the "baby boom"). I suspect certain segments of the population were under stress before the recession started - like construction workers - and even more families were in distress in 2008 through 2012. And this led to fewer babies.
Notice that the number of births started declining a number of years before the Great Depression started. Many families in the 1920s were under severe stress long before the economy collapsed. By 1933 births were down by almost 23% from the early '20s levels.
Of course economic distress isn't the only reason births decline - look at the huge decline following the baby boom that was driven by demographics. But it is not surprising that the number of births slow or decline during tough economic times - but that appears to be over now.
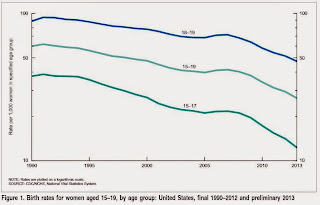
 The second graph is from the NCHS report and shows births per 1,000 women by teen age group. From the NCHS:
 The number of births to teenagers aged 15–19 in 2013 was 274,641, also down 10% from 2012 and the lowest number of teen births ever reported for the United States. The 2013 number of births was 38% less than in 2007 (444,899), the most recent high, and 57% less than in 1970, the all-time peak year for the number of teen births (644,708).Far fewer teens births is great news (and is probably related to the much higher enrollment rates).
Another key trends ... women are waiting longer to have babies:
The birth rate for women aged 20–24 was 81.2 births per 1,000 women in 2013, down 2% from the previous record low rate in 2012 (83.1). Since 2007, the rate for women in this age group has declined steadily at nearly 4% per year.Waiting longer to have children makes sense (see: Demographics and Behavior) and we should expect a baby boom in a few years as the largest cohorts move into the 25 to 34 years old age groups. (for largest cohorts, see: Census Bureau: Largest 5-year Population Cohort is now the "20 to 24" Age Group).
The 2013 preliminary birth rate for women aged 30–34 was 98.7 births per 1,000 women, up 1% from the rate in 2012 (97.3). The number of births to women in their early 30s also increased in 2013, by 2%. The rate for women aged 35–39 was 49.6 births per 1,000 women, up 3% from 2012 (48.3), reaching the highest rate for this age group since 1963. The number of births to women in their late 30s increased 3% in 2013.
P.S. I expect that as families have babies, they will tend to buy homes (as opposed to rent)! The demographics are favorable for renting now (see: The Favorable Demographics for Apartments), but eventually the demographics will be more positive for home ownership.


