by Calculated Risk on 1/27/2012 02:46:00 PM
Friday, January 27, 2012
LPS: 2010, 2011 Mortgage Originations have record low default rates
From LPS Applied Analytics: LPS' Mortgage Monitor Shows 2010, 2011 Originations Among Best Quality on Record
The December Mortgage Monitor report released by Lender Processing Services shows mortgage originations continued their decline from 2011’s September peak, down 10.1 percent from the month before. At the same time, those loans originated over the last two years have proven to be some of the best quality originations on record.According to LPS, 8.15% of mortgages were delinquent in December, unchanged from November, and down from 8.83% in December 2010.
...
Looking at judicial vs. non-judicial foreclosure states, LPS found that half of all loans in foreclosure in judicial states have not made a payment in more than two years. Foreclosure sale rates in non-judicial states stood at approximately four times that of judicial foreclosure states in December. Still, on average, pipeline ratios (the time it would take to clear through the inventory of loans either seriously delinquent or in foreclosure at the current rate of foreclosure sales) have declined significantly from earlier this year.
LPS reports that 4.11% of mortgages were in the foreclosure process, down from 4.16% in November, and down slightly from 4.15% in December 2010.
This gives a total of 12.26% delinquent or in foreclosure. It breaks down as:
• 2.31 million loans less than 90 days delinquent.
• 1.79 million loans 90+ days delinquent.
• 2.07 million loans in foreclosure process.
For a total of 6.17 million loans delinquent or in foreclosure in December.
 Click on graph for larger image.
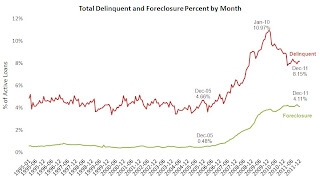
This graph shows the total delinquent and in-foreclosure rates since 1995.
The total delinquent rate has fallen to 8.15% from the peak in January 2010 of 10.97%, but the decline has "halted". A normal rate is probably in the 4% to 5% range, so there is a long ways to go.
The in-foreclosure rate was at 4.11%, down from the record high in October 2011 of 4.29%. There are still a large number of loans in this category (about 2.07 million). LPS reported that foreclosure starts were down nearly 40% in December, probably due to process issues.
 This graph provided by LPS Applied Analytics shows foreclosure inventories by process.
 As LPS noted earlier: "Judicial vs. non-judicial foreclosure processes remain a significant factor in the reduction of foreclosure pipelines from state to state, with non-judicial foreclosure inventory percentages less than half that of judicial states. This is largely a result of the fact that foreclosure sale rates in non-judicial states have been proceeding at four to five times that of judicial. Non-judicial foreclosure states made up the entirety of the top 10 states with the largest year-over-year decline in non-current loans percentages."
 The third graph shows the 90+ day default rate by vintage.
LPS noted "2010 and 2011 originations are among the best on record".
And this isn't just because of tighter lending standards, LPS also noted (see report) that there were vintage improvements for high risk cohorts too (high risk defined as "Credit Score less than 660 and LTV greater than 80").
Notice the early payment default for the bubble years. The jump in payment 3 means the buyer missed the first three payments!
Overall this means newer loans are performing very well, but that there are a large number of delinquent loans stuck in the pipeline - especially in the judicial states.


