 RSS Feed
 by Calculated Risk on 3/21/2018 11:33:00 AM
Wednesday, March 21, 2018
AIA: "Architecture billings continue to hold positive in 2018"
Note: This index is a leading indicator primarily for new Commercial Real Estate (CRE) investment.
From the AIA: Architecture billings continue to hold positive in 2018
The American Institute of Architects (AIA) is reporting an increase in architecture firm billings for February from its Architecture Billings Index (ABI), with several key segments showing an encouraging outlook for 2018.
“We remain optimistic about the trends we’re seeing at architecture firms this year with the ABI continuing to show growth in February,” said AIA Chief Economist, Kermit Baker, Hon. AIA, PhD. “We saw several major bright spots reflected in February’s data, as billings remained particularly strong at firms located in the West and Midwest.”
While the pace of growth in design activity slowed a bit in February for an ABI score of 52.0 (any score over 50 indicates billings growth), it still reflects a healthy business environment. In particular, firms with a multifamily residential or an institutional specialization continued to report extremely strong billings.
...
• Regional averages: West (57.6), Midwest (54.5), South (54.4), Northeast (47.5)
• Sector index breakdown: multi-family residential (56.6), institutional (53.8), commercial/industrial (51.0), mixed practice (49.7)
emphasis added
 Click on graph for larger image.
This graph shows the Architecture Billings Index since 1996. The index was at 52.0 in February, down from 54.7 in January. Anything above 50 indicates expansion in demand for architects' services.
Note: This includes commercial and industrial facilities like hotels and office buildings, multi-family residential, as well as schools, hospitals and other institutions.
According to the AIA, there is an "approximate nine to twelve month lag time between architecture billings and construction spending" on non-residential construction. This index was positive in 11 of the last 12 months, suggesting a further increase in CRE investment in 2018.
NAR: "Existing-Home Sales Rebound 3.0 Percent in February"
by Calculated Risk on 3/21/2018 10:12:00 AM
From the NAR: Existing-Home Sales Rebound 3.0 Percent in February
Despite consistently low inventory levels and faster price growth, existing-home sales bounced back in February after two straight months of declines, according to the National Association of Realtors®. Sizeable sales increases in the South and West offset declines in the Northeast and Midwest.
Total existing-home sales, which are completed transactions that include single-family homes, townhomes, condominiums and co-ops, grew 3.0 percent to a seasonally adjusted annual rate of 5.54 million in February from 5.38 million in January. After last month’s increase, sales are now 1.1 percent above a year ago.
...
Total housing inventory at the end of February rose 4.6 percent to 1.59 million existing homes available for sale, but is still 8.1 percent lower than a year ago (1.73 million) and has fallen year-over-year for 33 consecutive months. Unsold inventory is at a 3.4-month supply at the current sales pace (3.8 months a year ago).
emphasis added
 Click on graph for larger image.
This graph shows existing home sales, on a Seasonally Adjusted Annual Rate (SAAR) basis since 1993.
Sales in January (5.54 million SAAR) were 3.0% higher than last month, and were 1.1% above the February 2017 rate.
The second graph shows nationwide inventory for existing homes.
 According to the NAR, inventory increased to 1.59 million in February from 1.52 million in January. Headline inventory is not seasonally adjusted, and inventory usually decreases to the seasonal lows in December and January, and peaks in mid-to-late summer.
The last graph shows the year-over-year (YoY) change in reported existing home inventory and months-of-supply. Since inventory is not seasonally adjusted, it really helps to look at the YoY change. Note: Months-of-supply is based on the seasonally adjusted sales and not seasonally adjusted inventory.
 Inventory decreased 8.1% year-over-year in February compared to February 2017.
 Months of supply was at 3.4 months in February.
Sales were above the consensus view. For existing home sales, a key number is inventory - and inventory is still low. I'll have more later ...
MBA: Purchase Mortgage Applications Decrease in Latest Weekly Survey
by Calculated Risk on 3/21/2018 07:00:00 AM
From the MBA: Mortgage Applications Decrease in Latest MBA Weekly Survey
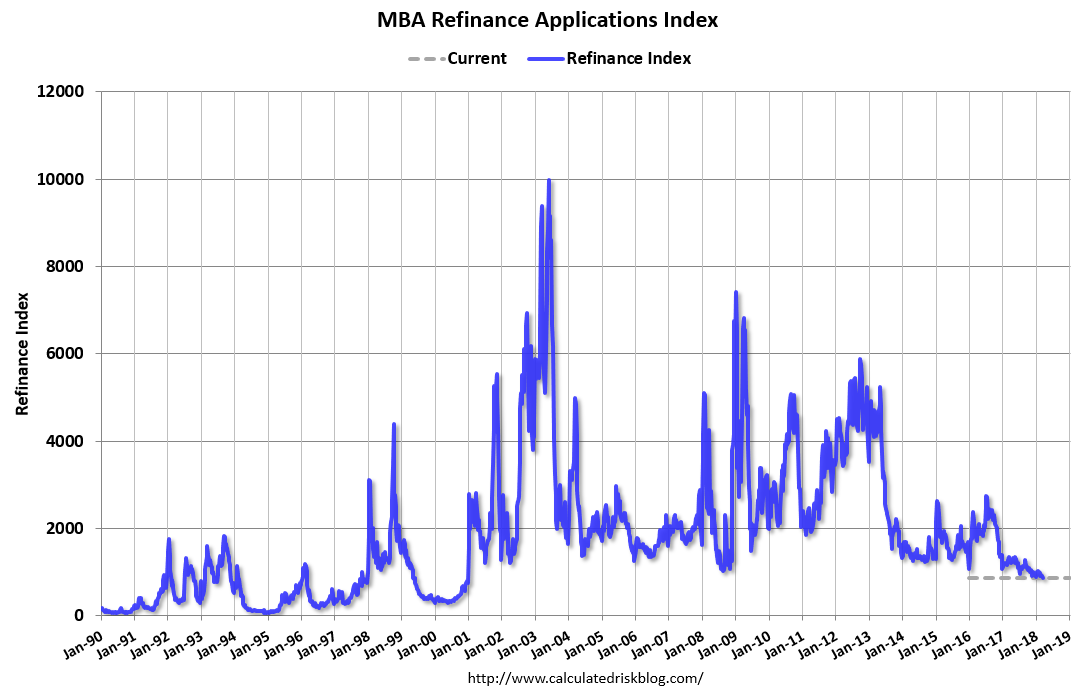
Mortgage applications decreased 1.1 percent from one week earlier, according to data from the Mortgage Bankers Association’s (MBA) Weekly Mortgage Applications Survey for the week ending March 16, 2018.
... The Refinance Index decreased 5 percent from the previous week. The seasonally adjusted Purchase Index increased 1 percent from one week earlier. The unadjusted Purchase Index increased 2 percent compared with the previous week and was 6 percent higher than the same week one year ago. ...
The average contract interest rate for 30-year fixed-rate mortgages with conforming loan balances ($453,100 or less) decreased to 4.68 percent from 4.69 percent, with points increasing to 0.46 from 0.45 (including the origination fee) for 80 percent loan-to-value ratio (LTV) loans.
emphasis added
 Click on graph for larger image.
The first graph shows the refinance index since 1990.
Refinance activity will not pick up significantly unless mortgage rates fall 50 bps or more from the recent level.
 The second graph shows the MBA mortgage purchase index
 According to the MBA, purchase activity is up 6% year-over-year.
Tuesday, March 20, 2018
Wednesday: FOMC Announcement, Existing Home Sales
by Calculated Risk on 3/20/2018 06:36:00 PM
Here is my FOMC preview and a preview from Goldman Sachs economists.
Wednesday:
• At 7:00 AM ET, The Mortgage Bankers Association (MBA) will release the results for the mortgage purchase applications index.
• At 10:00 AM, Existing Home Sales for February from the National Association of Realtors (NAR). The consensus is for 5.42 million SAAR, up from 5.38 million in January. Housing economist Tom Lawler expects the NAR to report sales of 5.44 million SAAR for February.
• During the day, The AIA's Architecture Billings Index for February (a leading indicator for commercial real estate).
• At 2:00 PM, FOMC Meeting Announcement. The FOMC is expected to increase the Fed Funds rate 25 bps at this meeting.
• At 2:00 PM, FOMC Forecasts This will include the Federal Open Market Committee (FOMC) participants' projections of the appropriate target federal funds rate along with the quarterly economic projections.
• At 2:30 PM, Fed Chair Jerome Powell holds a press briefing following the FOMC announcement.
Mortgage Equity Withdrawal slightly positive in Q4
by Calculated Risk on 3/20/2018 02:28:00 PM
Note: This is not Mortgage Equity Withdrawal (MEW) data from the Fed. The last MEW data from Fed economist Dr. Kennedy was for Q4 2008.
The following data is calculated from the Fed's Flow of Funds data (released yesterday) and the BEA supplement data on single family structure investment. This is an aggregate number, and is a combination of homeowners extracting equity - hence the name "MEW" - and normal principal payments and debt cancellation (modifications, short sales, and foreclosures).
For Q4 2017, the Net Equity Extraction was a positive $13 billion, or a positive 0.4% of Disposable Personal Income (DPI) .
 Click on graph for larger image.
This graph shows the net equity extraction, or mortgage equity withdrawal (MEW), results, using the Flow of Funds (and BEA data) compared to the Kennedy-Greenspan method.
Note: This data is impacted by debt cancellation and foreclosures, but much less than a few years ago.
MEW has been positive for 7 consecutive quarters, and 9 of the last 10 quarters. With a slower rate of debt cancellation, MEW will likely be mostly positive going forward.
The Fed's Flow of Funds report showed that the amount of mortgage debt outstanding increased by $68 billion in Q4.
The Flow of Funds report also showed that Mortgage debt has declined by $0.6 trillion since the peak. This decline is mostly because of debt cancellation per foreclosures and short sales, and some from modifications. There has also been some reduction in mortgage debt as homeowners paid down their mortgages so they could refinance.
For reference:
Dr. James Kennedy also has a simple method for calculating equity extraction: "A Simple Method for Estimating Gross Equity Extracted from Housing Wealth". Here is a companion spread sheet (the above uses my simple method).
For those interested in the last Kennedy data included in the graph, the spreadsheet from the Fed is available here.
Chemical Activity Barometer Increased in March
by Calculated Risk on 3/20/2018 12:06:00 PM
Note: This appears to be a leading indicator for industrial production.
From the American Chemistry Council: In Like a Lion: Leading Economic Indicator Logs Strong Year Over Year Growth; Marks Sixth Consecutive Gain
The Chemical Activity Barometer (CAB), a leading economic indicator created by the American Chemistry Council (ACC), expanded 0.2 percent in March on a three-month moving average (3MMA) basis, its sixth consecutive gain following the 2017 hurricanes. The barometer remains up 3.8 percent on a 3MMA compared to a year earlier.
...
Applying the CAB back to 1912, it has been shown to provide a lead of two to fourteen months, with an average lead of eight months at cycle peaks as determined by the National Bureau of Economic Research. The median lead was also eight months. At business cycle troughs, the CAB leads by one to seven months, with an average lead of four months. The median lead was three months. The CAB is rebased to the average lead (in months) of an average 100 in the base year (the year 2012 was used) of a reference time series. The latter is the Federal Reserve’s Industrial Production Index.
emphasis added
 Click on graph for larger image.
This graph shows the year-over-year change in the 3-month moving average for the Chemical Activity Barometer compared to Industrial Production. It does appear that CAB (red) generally leads Industrial Production (blue).
The year-over-year increase in the CAB has been solid over the last year, suggesting further gains in industrial production in 2018.
Demographics: Renting vs. Owning
by Calculated Risk on 3/20/2018 10:15:00 AM
Note; This is an update to a post I wrote in 2015.
It was almost 9 years ago that we started discussing the turnaround for apartments. Then, in January 2011, I attended the NMHC Apartment Strategies Conference in Palm Springs, and the atmosphere was very positive.
The drivers in 2011 were 1) very low new supply for apartments, and 2) strong demand (both favorable demographics, and people moving from owning to renting).
The move "from owning to renting" is over, and demographics for apartments are much less favorable than 7 years ago. Also much more supply has come online. Slowing demand and more supply for apartments is why multi-family starts have slowed recently (multi-family starts probably peaked in 2015).
| Multi-family Starts by Year | |
|---|---|
| Year | 5+ Units (000s) |
| 2005 | 311.4 |
| 2006 | 292.8 |
| 2007 | 277.3 |
| 2008 | 266.0 |
| 2009 | 97.3 |
| 2010 | 104.3 |
| 2011 | 167.3 |
| 2012 | 233.9 |
| 2013 | 293.7 |
| 2014 | 341.7 |
| 2015 | 385.8 |
| 2016 | 380.8 |
| 2017 | 342.7 |
On demographics, a large cohort had been moving into the 20 to 29 year old age group (a key age group for renters). Going forward, a large cohort will be moving into the 30 to 39 age group (a key for ownership).
Note: Household formation would be a better measure than population, but reliable data for households is released with a long lag.
NOTE: This graph is updated using the Vintage 2017 estimates.
 Click on graph for larger image.
This graph shows the longer term trend for three key age groups: 20 to 29, 25 to 34, and 30 to 39 (the groups overlap).
This graph is from 1990 to 2060 (all data from BLS: current to 2060 is projected).
We can see the surge in the 20 to 29 age group (red). Once this group exceeded the peak in earlier periods, there was an increase in apartment construction. This age group will peak in 2018 (until the 2030s), and the 25 to 34 age group (orange, dashed) will peak in 2023. This suggests demand for apartments is probably softening.
For buying, the 30 to 39 age group (blue) is important (note: see Demographics and Behavior for some reasons for changing behavior). The population in this age group is increasing, and will increase significantly over the next 6+ years.
This demographics is now positive for home buying, and this is a key reason I expect single family housing starts to continue to increase.
Monday, March 19, 2018
"Mortgage Rates Maintain Flat Trajectory Ahead of Fed"
by Calculated Risk on 3/19/2018 06:26:00 PM
From Matthew Graham at Mortgage News Daily: Mortgage Rates Maintain Flat Trajectory Ahead of Fed
Mortgage rates have been on a tear recently, moving sideways with reckless abandon. Since the middle of February, the "effective rate" (based on actual rate sheet offerings and upfront costs) has held inside a narrow range of 4.52% and 4.58%. This lies in stark contrast to the persistent move higher during the first month and a half of 2018 which saw the same effective rate rise from roughly 4.0% into the 4.5% range.Here is a table from Mortgage News Daily:
When rates are as flat as they are on the approach to a key market event like this Wednesday's Fed announcement. We often see a break in that narrow range after the key event. [30YR FIXED - 4.5-4.625%]
emphasis added
Lawler: Early Read on Existing Home Sales in February
by Calculated Risk on 3/19/2018 03:19:00 PM
From housing economist Tom Lawler: Early Read on Existing Home Sales in February
Based on publicly-available local realtor/MLS reports from across the country released through today, I project that existing home sales as estimated by the National Association of Realtors ran at a seasonally adjusted annual rate of 5.44 million in February, up 1.1% from January’s preliminary pace and down 0.5% from last February’s seasonally adjusted pace.
On the inventory front, realtor/MLS data suggest that home listings showed a similar YOY decline last month compared to January, and my “best guess” is that the NAR’s estimate of the inventory of existing homes for sale in January will be 1.57 million, up 3.3% from January’s preliminary estimate and down 9.2% from last February.
Finally, local realtor/MLS data would be consistent with a YOY increase in the NAR’s estimate of the median existing SF home sales price of about 7.5%. I should note that lately the NAR’s estimated YOY gain in median existing SF home sale prices has been south of what local realtor data would have suggested, though I do not know why.
CR Note: Existing home sales for February are scheduled to be released by the NAR on Wednesday. The consensus is for 5.42 million SAAR, up from 5.38 million in January.
Q1 GDP Forecasts
by Calculated Risk on 3/19/2018 11:35:00 AM
Here are few Q1 GDP forecast.
From Merrill Lynch:
We continue to track 1.7% qoq saar for 1Q GDP [March 19 estimate].And from the Altanta Fed: GDPNow
The GDPNow model estimate for real GDP growth (seasonally adjusted annual rate) in the first quarter of 2018 is 1.8 percent on March 16, down from 1.9 percent on March 14.From the NY Fed Nowcasting Report
The New York Fed Staff Nowcast stands at 2.7% for 2018:Q1 and 2.8% for 2018:Q2. [March 16 estimate]CR Note: It looks like another weak Q1, and there might still be some residual seasonality in the first quarter.


