by Calculated Risk on 7/19/2017 03:15:00 PM
Wednesday, July 19, 2017
Comments on June Housing Starts
Earlier: Housing Starts increased to 1.215 Million Annual Rate in June
The housing starts report released this morning showed starts were up 8.3% in June compared to May, and were up 2.1% year-over-year compared to June 2016. This was a solid report and was above the consensus forecast.
Note that multi-family starts are volatile month-to-month, and has seen wild swings over the last year.
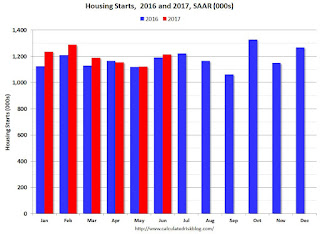
This first graph shows the month to month comparison between 2016 (blue) and 2017 (red).

Starts were up 2.1% in June 2017 compared to June 2016, and starts are up 6.0% year-to-date.
Note that single family starts are up 10.7% year-to-date, and the weakness (as expected) has been in multi-family starts.
My guess is starts will increase around 3% to 7% in 2017.
Below is an update to the graph comparing multi-family starts and completions. Since it usually takes over a year on average to complete a multi-family project, there is a lag between multi-family starts and completions. Completions are important because that is new supply added to the market, and starts are important because that is future new supply (units under construction is also important for employment).
These graphs use a 12 month rolling total for NSA starts and completions.

The rolling 12 month total for starts (blue line) increased steadily over the last few years - but has turned down recently. Completions (red line) have lagged behind - but completions have been generally catching up (more deliveries). Completions lag starts by about 12 months.
I think the growth in multi-family starts is behind us - in fact, multi-family starts probably peaked in June 2015 (at 510 thousand SAAR) - although I expect solid multi-family starts for a few more years (based on demographics).

Note the exceptionally low level of single family starts and completions. The "wide bottom" was what I was forecasting following the recession, and now I expect a few years of increasing single family starts and completions.
AIA: Architecture Billings Index positive in June
by Calculated Risk on 7/19/2017 09:52:00 AM
Note: This index is a leading indicator primarily for new Commercial Real Estate (CRE) investment.
From the AIA: Architecture firms end second quarter on a strong note
For the fifth consecutive month, architecture firms recorded increasing demand for design services as reflected in the June Architecture Billings Index (ABI). As a leading economic indicator of construction activity, the ABI reflects the approximate nine to twelve month lead time between architecture billings and construction spending. The American Institute of Architects (AIA) reported the June ABI score was 54.2, up from a score of 53.0 in the previous month. This score reflects an increase in design services (any score above 50 indicates an increase in billings). The new projects inquiry index was 58.6, down from a reading of 62.4 the previous month, while the new design contracts index decreased from 54.8 to 53.7.
“So far this year, new activity coming into architecture firms has generally exceeded their ability to complete ongoing projects,” said AIA Chief Economist, Kermit Baker, Hon. AIA, PhD. “Now, firms seem to be ramping up enough to manage these growing workloads.”
...
• Regional averages: South (54.8), West (53.1), Midwest (51.9), Northeast (51.5)
• Sector index breakdown: multi-family residential (57.1), mixed practice (53.8), institutional (52.6), commercial / industrial (52.1)
emphasis added
 Click on graph for larger image.
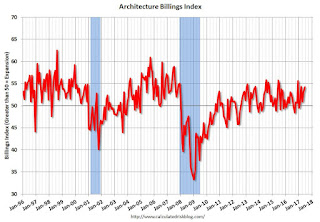
This graph shows the Architecture Billings Index since 1996. The index was at 54.2 in June, up from 53.0 the previous month. Anything above 50 indicates expansion in demand for architects' services.
Note: This includes commercial and industrial facilities like hotels and office buildings, multi-family residential, as well as schools, hospitals and other institutions.
According to the AIA, there is an "approximate nine to twelve month lag time between architecture billings and construction spending" on non-residential construction. This index was positive in 9 of the last 12 months, suggesting a further increase in CRE investment in 2017 and early 2018.
Housing Starts increased to 1.215 Million Annual Rate in June
by Calculated Risk on 7/19/2017 08:39:00 AM
From the Census Bureau: Permits, Starts and Completions
Housing Starts:
Privately-owned housing starts in June were at a seasonally adjusted annual rate of 1,215,000. This is 8.3 percent above the revised May estimate of 1,122,000 and is 2.1 percent above the June 2016 rate of 1,190,000. Single-family housing starts in June were at a rate of 849,000; this is 6.3 percent above the revised May figure of 799,000. The June rate for units in buildings with five units or more was 359,000.
Building Permits:
Privately-owned housing units authorized by building permits in June were at a seasonally adjusted annual rate of 1,254,000. This is 7.4 percent above the revised May rate of 1,168,000 and is 5.1 percent above the June 2016 rate of 1,193,000. Single-family authorizations in June were at a rate of 811,000; this is 4.1 percent above the revised May figure of 779,000. Authorizations of units in buildings with five units or more were at a rate of 409,000 in June.
emphasis added
 Click on graph for larger image.
The first graph shows single and multi-family housing starts for the last several years.
Multi-family starts (red, 2+ units) increased in June compared to May. Multi-family starts are down 13% year-over-year.
Multi-family is volatile month-to-month, but has been mostly moving sideways over the last couple of years.
Single-family starts (blue) increased in May, and are up 10.3% year-over-year.
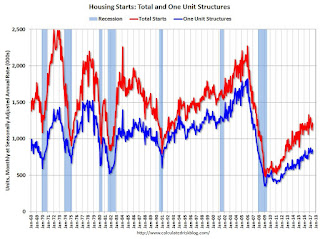
 The second graph shows total and single unit starts since 1968.
 The second graph shows the huge collapse following the housing bubble, and then - after moving sideways for a couple of years - housing is now recovering (but still historically low),
Total housing starts in June were above expectations, and starts for May were revised up. This was a solid report. I'll have more later ...
MBA: Mortgage Applications Increase in Latest Weekly Survey
by Calculated Risk on 7/19/2017 07:00:00 AM
From the MBA: Mortgage Applications Increase in Latest MBA Weekly Survey
Mortgage applications increased 6.3 percent from one week earlier, according to data from the Mortgage Bankers Association’s (MBA) Weekly Mortgage Applications Survey for the week ending July 14, 2017. Last week’s results included an adjustment for the Fourth of July holiday.
... The Refinance Index increased 13 percent from the previous week. The seasonally adjusted Purchase Index increased 1 percent from one week earlier. The unadjusted Purchase Index increased 27 percent compared with the previous week and was 7 percent higher than the same week one year ago. ...
The average contract interest rate for 30-year fixed-rate mortgages with conforming loan balances ($424,100 or less) remained unchanged at 4.22 percent, with points decreasing to 0.31 from 0.40 (including the origination fee) for 80 percent loan-to-value ratio (LTV) loans.
emphasis added
 Click on graph for larger image.
The first graph shows the refinance index since 1990.
Refinance activity will not pick up significantly unless mortgage rates fall well below 4%.
 The second graph shows the MBA mortgage purchase index.
 According to the MBA, purchase activity is up 7% year-over-year.
Tuesday, July 18, 2017
Wednesday: Housing Starts
by Calculated Risk on 7/18/2017 06:32:00 PM
Wednesday:
• At 7:00 AM ET, The Mortgage Bankers Association (MBA) will release the results for the mortgage purchase applications index.
• At 8:30 AM, Housing Starts for June. The consensus is for 1.170 million SAAR, up from the May rate of 1.092 million.
• During the day: The AIA's Architecture Billings Index for June (a leading indicator for commercial real estate).
Housing and Policy
by Calculated Risk on 7/18/2017 01:41:00 PM
The NAHB Builder confidence survey declined this morning (although still solid), and the NAHB blamed the rising prices, especially for lumber. As Diana Olick noted on CNBC:
Builder confidence jumped 6 points from November to December (63 to 69) and then jumped again to 71 in March, following the administration's repeal of certain environmental regulations specifically involving water.Those tariffs are impacting lumber prices.
Now, new tariffs on Canadian lumber of up to 24 percent announced by the Trump administration in May, as well as the expectation of additional tariffs on other homebuilding materials imported from overseas, are overtaking the benefits of deregulation. The cost of framing lumber has spiked in recent months and continues to rise today, which only exacerbates already rising prices for land and skilled labor.
 Click on graph for larger image in graph gallery.
This graph shows two measures of lumber prices: 1) Framing Lumber from Random Lengths through June 2017 (via NAHB), and 2) CME framing futures.
Right now Random Lengths prices are up 14% from a year ago, and CME futures are up about 18% year-over-year.
And immigration policy will likely slow household formation. Housing economist Tom Lawler wrote an excellent article last month: Lawler: Reasonable Population Projections Are Important!. Here are some excepts (look at the table and see how important immigration is for household formation).
From Tom Lawler:
[B]elow is a table of what labor force growth and US household formations would be under each scenario if (1) labor force participation rates by age remained constant at 2016 levels; and (2) household headship rates by age remain constant at my “best guess” rates for 2016 (there are no good, reliable data on households since 2010, but that is a different story!). I realize, of course, that holding labor force participation rates and headship rates by age constant is not a “best guess” projection, but I’m just trying to show sensitivities to different population assumptions.
| Annual Growth Rate in the US Labor Force Assuming Constant Labor Force Participation Rates by Age | |||
|---|---|---|---|
| 2018 | 2019 | 2020 | |
| Zero Net International Migration | 0.04% | 0.02% | -0.01% |
| NIM of 700,000/year | 0.28% | 0.27% | 0.24% |
| Census 2014 Projections | 0.50% | 0.50% | 0.48% |
| US Household Growth Assuming Constant Headship Rates by Age | |||
| 2018 | 2019 | 2020 | |
| Zero Net International Migration | 1,026,077 | 966,155 | 924,937 |
| NIM of 700,000/year | 1,231,995 | 1,180,916 | 1,148,645 |
| Census 2014 Projections | 1,485,278 | 1,455,615 | 1,442,362 |
As the table suggests, analysts using the extremely dated Census 2014 population projections would conclude that the US would have “decent” labor force growth and quite strong US household growth over the next three years. Contrary to what some analysts suggest, however, that strong growth is not in the main the result of the current “demographics” of the population, but rather is mainly the result of what are now clearly unrealistically high assumptions about net international migration. If instead the US had zero net international migration of the next three years, the US labor force would show no growth unless labor force participation rates increased, and US household growth would average less than one million per year unless headship rates increased. Not surprisingly, a “sorta Trumpy” scenario of net international migration of 700,000 a year – probably the closest there is a a “base case” scenario” produces projections about half way in between these two extremes.From a policy perspective, it is possible that deregulation could give a boost to housing (and also changes in local ordinances), but the current trade and immigration policies are a net negative for the U.S. economy and especially housing.
NAHB: Builder Confidence decreased to 64 in July
by Calculated Risk on 7/18/2017 10:06:00 AM
The National Association of Home Builders (NAHB) reported the housing market index (HMI) was at 64 in July, down from 66 in June. Any number above 50 indicates that more builders view sales conditions as good than poor.
From NAHB: Builder Confidence Slips Two Points in July, Remains Solid
Builder confidence in the market for newly-built single-family homes slipped two points in July to a level of 64 from a downwardly revised June reading on the National Association of Home Builders/Wells Fargo Housing Market Index (HMI). It is the lowest reading since November 2016.
“Our members are telling us they are growing increasingly concerned over rising material prices, particularly lumber,” said NAHB Chairman Granger MacDonald, a home builder and developer from Kerrville, Texas. “This is hurting housing affordability even as consumer interest in the new-home market remains strong.”
“The HMI measure of current sales conditions has been at 70 or higher for eight straight months, indicating strong demand for new homes,” said NAHB Chief Economist Robert Dietz. “However, builders will need to manage some increasing supply-side costs to keep home prices competitive.”
...
All three HMI components registered losses in July but are still in solid territory. The components gauging current sales conditions fell two points to 70 while the index charting sales expectations in the next six months dropped two points to 73. Meanwhile, the component measuring buyer traffic slipped one point to 48.
Looking at the three-month moving averages for regional HMI scores, the Northeast rose one point to 47. The West and Midwest each edged one point lower to 75 and 66, respectively. The South dropped three points to 67.
emphasis added
 Click on graph for larger image.
This graph show the NAHB index since Jan 1985.
Note: Both Trump's trade and immigration policies are bad for housing.
This was below the consensus forecast, but still a solid reading.
Monday, July 17, 2017
Tuesday: Homebuilder Survey
by Calculated Risk on 7/17/2017 07:58:00 PM
From Matthew Graham at Mortgage News Daily: Mortgage Rates Higher Despite Friendly Market Movement
Mortgage rates are largely dictated by movements in bond markets--specifically mortgage-backed securities (MBS). When bonds improve, prices rise and investors are willing to pay more to buy loans. This results in rates moving lower. In other words, bond market improvement = lower rates.Tuesday:
With all of that in mind, today is a bit of a paradox as the average lender is quoting slightly higher rates today, despite general improvements in bond markets. Nothing too terribly mysterious is at work here though. The inconsistency has more to do with the timing of Friday's market movements and the generally narrow range over the past four days. Specifically, bonds weakened progressively into Friday afternoon and most lenders never fully adjusted rate sheets to account for that weakness. This left the average lender at a disadvantage to begin the new week and today's gains in bond markets weren't enough to offset it.
The most prevalently-quoted conventional 30yr fixed rates remain in a range from 4.0%-4.125% on top tier scenarios. Most clients will not see any change in the "rate" side of the equation compared to Friday, thus implying moderately higher upfront costs.
• At 10:00 AM ET, The July NAHB homebuilder survey. The consensus is for a reading of 68, up from 67 in June. Any number above 50 indicates that more builders view sales conditions as good than poor.
LA area Port Traffic increased in June
by Calculated Risk on 7/17/2017 01:22:00 PM
Container traffic gives us an idea about the volume of goods being exported and imported - and usually some hints about the trade report since LA area ports handle about 40% of the nation's container port traffic.
The following graphs are for inbound and outbound traffic at the ports of Los Angeles and Long Beach in TEUs (TEUs: 20-foot equivalent units or 20-foot-long cargo container).
To remove the strong seasonal component for inbound traffic, the first graph shows the rolling 12 month average.

On a rolling 12 month basis, inbound traffic was up 0.5% compared to the rolling 12 months ending in May. Outbound traffic was down 0.1% compared to the rolling 12 months ending in May.
The 2nd graph is the monthly data (with a strong seasonal pattern for imports).

In general imports have been increasing, and exports are moving sideways.
U.S. Heavy Truck Sales increased following Oil Price Related Slump
by Calculated Risk on 7/17/2017 10:43:00 AM
The following graph shows heavy truck sales since 1967 using data from the BEA. The dashed line is the June 2017 seasonally adjusted annual sales rate (SAAR).
Heavy truck sales really collapsed during the great recession, falling to a low of 181 thousand in April and May 2009, on a seasonally adjusted annual rate basis (SAAR). Then sales increased more than 2 1/2 times, and hit 479 thousand SAAR in June 2015.
Heavy truck sales declined again - probably mostly due to the weakness in the oil sector - and bottomed at 352 thousand SAAR in October 2016.
Click on graph for larger image.
With the increase in oil prices over the last year, heavy truck sales have been increasing too.
Heavy truck sales were at 402 thousand SAAR in June 2017.>


