 RSS Feed
 by Calculated Risk on 3/02/2017 02:53:00 PM
Thursday, March 02, 2017
Demographics: Renting vs. Owning
Note; This is an update to a post I wrote in 2015.
It was almost 7 years ago that we started discussing the turnaround for apartments. Then, in January 2011, I attended the NMHC Apartment Strategies Conference in Palm Springs, and the atmosphere was very positive.
The drivers in 2011 were 1) very low new supply for apartments, and 2) strong demand (both favorable demographics, and people moving from owning to renting).
The move "from owning to renting" is mostly over, and demographics for apartments are much less favorable than 6 years ago. Also much more supply has come online. Slowing demand and more supply for apartments is why I think growth in multi-family starts will be flat or slow further this year (multi-family starts probably peaked in 2015).
| Multi-family Starts by Year | |
|---|---|
| Year | 5+ Units (000s) |
| 2005 | 311.4 |
| 2006 | 292.8 |
| 2007 | 277.3 |
| 2008 | 266.0 |
| 2009 | 97.3 |
| 2010 | 104.3 |
| 2011 | 167.3 |
| 2012 | 233.9 |
| 2013 | 293.7 |
| 2014 | 341.7 |
| 2015 | 385.8 |
| 2016 | 381.0 |
On demographics, a large cohort had been moving into the 20 to 29 year old age group (a key age group for renters). Going forward, a large cohort will be moving into the 30 to 39 age group (a key for ownership).
Note: Household formation would be a better measure than population, but reliable data for households is released with a long lag.
 Click on graph for larger image.
This graph shows the longer term trend for three key age groups: 20 to 29, 25 to 34, and 30 to 39 (the groups overlap).
This graph is from 1990 to 2060 (all data from BLS: current to 2060 is projected).
We can see the surge in the 20 to 29 age group (red). Once this group exceeded the peak in earlier periods, there was an increase in apartment construction. This age group will peak in 2018 (until the 2030s), and the 25 to 34 age group (orange, dashed) will peak in 2023. This suggests demand for apartments will soften in a few years.
For buying, the 30 to 39 age group (blue) is important (note: see Demographics and Behavior for some reasons for changing behavior). The population in this age group is increasing, and will increase significantly over the next decade.
This demographics is positive for home buying, and this is a key reason I expect single family housing starts to continue to increase in coming years.
Merrill on Possible March Fed Hike
by Calculated Risk on 3/02/2017 10:43:00 AM
Expectations of a March rate hike have increased significantly over the last few days. Some market based measures now show an 80%+ chance of a rate hike.
A few excerpts from Merrill Lynch research:
The market has moved dramatically in the past two days to price in a hike at the March meeting. This was partly triggered by hawkish commentary from regional Fed presidents, including NY Fed President Dudley yesterday. While we agree that the chances of a hike in March have increased, given the Fed commentary, we are sticking with our baseline forecast for the Fed to stay on hold at the next meeting and hike in June. That said, it is a very close call ...The FOMC meeting will be on March 14th and 15th.
...
What to watch:
1. Fed speeches, with particular focus on Yellen and Fischer on Friday. Will they push back at all against market pricing for March? Or will they make comments similar to Dudley ...
2. Employment report on March 10th: While the Fed does not respond to just one report, they would like to see something trend-like to support a hike. This means close to 175K on NFP, a 0.2/0.3% mom rebound in wages and the unemployment rate slipping/holding steady.
Weekly Initial Unemployment Claims decrease to 223,000
by Calculated Risk on 3/02/2017 09:18:00 AM
The DOL reported:
In the week ending February 25, the advance figure for seasonally adjusted initial claims was 223,000, a decrease of 19,000 from the previous week's revised level. This is the lowest level for initial claims since March 31, 1973 when it was 222,000. The previous week's level was revised down by 2,000 from 244,000 to 242,000. The 4-week moving average was 234,250, a decrease of 6,250 from the previous week's revised average. This is the lowest level for this average since April 14, 1973 when it was 232,750. The previous week's average was revised down by 500 from 241,000 to 240,500.The previous week was revised down.
emphasis added
The following graph shows the 4-week moving average of weekly claims since 1971.
 Click on graph for larger image.
The dashed line on the graph is the current 4-week average. The four-week average of weekly unemployment claims decreased to 234,250.
This was lower then the consensus forecast.
The low level of claims suggests relatively few layoffs.
Wednesday, March 01, 2017
Duy: On the Fed, Possible March Rate Hike, and Dudley
by Calculated Risk on 3/01/2017 07:29:00 PM
From Tim Duy at Bloomberg: Timing of the Next Fed Rate Hike Is Now a Balancing Act
Will they or won’t they? Bond traders are now pricing in odds above 75 percent that Federal Reserve policy makers will raise interest rates when they meet in two weeks, but there is still plenty of data to chew on before then. ...And from Duy at Fed Watch: More on Dudley
The timing of the next hike is a balancing act between the need for preemptive policy to stave off inflationary pressure against the desire to let labor market strength continue to eat away at any residual underemployment. As of December, the median Federal Open Market Committee participant believed that balance was met with three 25 basis-point hikes in 2017.
...
That number, however, is somewhat deceptive as some of the more hawkish FOMC members, such as Richmond Federal Reserve President Jeffrey Lacker, aren’t voting members this year. The voters have tended to tilt dovish, which is why I describe the forecasts within the Fed’s Summary of Economic Projections as pointing toward two hikes with an option on a third. That speaks to moves in June and December and possibly September.
I think in this interview Dudley is doing a good job explaining policy in terms of the forecast. That is something the Fed needs to keep pushing. It doesn’t sound like the forecast or the risks have moved sufficiently to change the number of rate hikes expected this year. But he sure seems to be leaning toward pulling forward those hikes.CR Note: Just a reminder - for the last several years, every time it has been a close call whether the Fed will raise rates - the Fed has passed.
...
Bottom Line: When I read the interview, it is hard for me to see that he has a strong conviction for drawing forward the rate hike to March. It seems odd to do so if he sees no change in the forecast and downplays the impact of the upside risks. If he does want to move in March, it tells me then it has little to do with either factor and is entirely about staying ahead of the curve. It is about the need for a preemptive rate hike. If his forecast is for three hikes and he wants to hike in March, then his patience has ended and he wants those hikes frontloaded. If for FOMC participants as a whole the forecast has yet to change much, then it is possible that the even if they raise in March, the median projection of three rate hikes this year remains steady.
U.S. Light Vehicle Sales at 17.5 million annual rate in February
by Calculated Risk on 3/01/2017 03:10:00 PM
Based on a preliminary estimate from WardsAuto, light vehicle sales were at a 17.47 million SAAR in February.
That is down about 1% from February 2016, and unchanged from last month.

Click on graph for larger image.
This graph shows the historical light vehicle sales from the BEA (blue) and an estimate for February (red, light vehicle sales of 17.47 million SAAR from WardsAuto).
This was below the consensus forecast of 17.7 million for February.
After two consecutive years of record sales, it looks like sales will mostly move sideways in 2017.
 The second graph shows light vehicle sales since the BEA started keeping data in 1967.
Note: dashed line is current estimated sales rate.
Fed's Beige Book: Modest to Moderate expansion, Tight labor markets
by Calculated Risk on 3/01/2017 02:09:00 PM
Fed's Beige Book "This report was prepared at the Federal Reserve Bank of New York based on information collected on or before February 17, 2017."
Reports from all twelve Federal Reserve Districts indicated that the economy expanded at a modest to moderate pace from early January through mid-February. ... Labor markets remained tight in early 2017, with some Districts noting widening labor shortages. Employment grew moderately in most of the nation, though three Districts characterized growth as modest and two reported that it was little changed. A number of Districts noted that staffing firms were seeing brisk business for this time of year, and one noted more conversions from temporary to permanent workers. In general, wages in most Districts rose modestly or moderately, with a few reporting some pickup in the pace of wage growth. A number of Districts noted that shortages of skilled workers--particularly engineers and IT workers--were driving up their wages, and there were also some reports of labor shortages in the leisure and hospitality, construction and manufacturing industries.And on real estate:
emphasis added
Home construction and sales continued to expand modestly in most Districts, while residential rental markets were mixed. Home prices were steady to up modestly in most Districts, and a number of Districts noted low inventories of existing homes. Commercial real estate construction grew modestly, and sales and leasing activity grew moderately. Lending activity was steady to somewhat higher.Note that residential rental markets "were mixed".
Construction Spending decreased in January
by Calculated Risk on 3/01/2017 12:20:00 PM
Earlier today, the Census Bureau reported that overall construction spending decreased in January:
Construction spending during January 2017 was estimated at a seasonally adjusted annual rate of $1,180.3 billion, 1.0 percent below the revised December estimate of $1,192.2 billion. The January figure is 3.1 percent above the January 2016 estimate of $1,144.9 billion.Private spending increased, however public spending decreased in January:
Spending on private construction was at a seasonally adjusted annual rate of $911.6 billion, 0.2 percent above the revised December estimate of $909.4 billion ...
In January, the estimated seasonally adjusted annual rate of public construction spending was $268.7 billion, 5.0 percent below the revised December estimate of $282.8 billion.
emphasis added
 Click on graph for larger image.
This graph shows private residential and nonresidential construction spending, and public spending, since 1993. Note: nominal dollars, not inflation adjusted.
Private residential spending has been generally increasing, and is still 30% below the bubble peak.
Non-residential spending is now 5% above the previous peak in January 2008 (nominal dollars).
Public construction spending is now 17% below the peak in March 2009, and only 2% above the austerity low in February 2014.
 The second graph shows the year-over-year change in construction spending.
On a year-over-year basis, private residential construction spending is up 6%. Non-residential spending is up 9% year-over-year. Public spending is down 9% year-over-year.
Looking forward, all categories of construction spending should increase in 2017.
This was below the consensus forecast of a 0.2% increase for January, however the previous months were revised up.
ISM Manufacturing index increased to 57.7 in February
by Calculated Risk on 3/01/2017 10:04:00 AM
The ISM manufacturing index indicated expansion in February. The PMI was at 57.7% in February, up from 56.0% in January. The employment index was at 54.2%, down from 56.1% last month, and the new orders index was at 65.1%, up from 60.4%.
From the Institute for Supply Management: February 2017 Manufacturing ISM® Report On Business®
Economic activity in the manufacturing sector expanded in February, and the overall economy grew for the 93rd consecutive month, say the nation’s supply executives in the latest Manufacturing ISM® Report On Business®.
The report was issued today by Bradley J. Holcomb, CPSM, CPSD, chair of the Institute for Supply Management® (ISM®) Manufacturing Business Survey Committee: “The February PMI® registered 57.7 percent, an increase of 1.7 percentage points from the January reading of 56 percent. The New Orders Index registered 65.1 percent, an increase of 4.7 percentage points from the January reading of 60.4 percent. The Production Index registered 62.9 percent, 1.5 percentage points higher than the January reading of 61.4 percent. The Employment Index registered 54.2 percent, a decrease of 1.9 percentage points from the January reading of 56.1 percent. Inventories of raw materials registered 51.5 percent, an increase of 3 percentage points from the January reading of 48.5 percent. The Prices Index registered 68 percent in February, a decrease of 1 percentage point from the January reading of 69 percent, indicating higher raw materials prices for the 12th consecutive month. Comments from the panel largely indicate strong sales and demand, and reflect a positive view of business conditions with a watchful eye on commodities and the potential for inflation.”
emphasis added
 Click on graph for larger image.
Here is a long term graph of the ISM manufacturing index.
This was above expectations of 56.1%, and suggests manufacturing expanded at as faster pace in February than in January.
Another solid report.
Personal Income increased 0.4% in January, Spending increased 0.2%
by Calculated Risk on 3/01/2017 09:02:00 AM
The BEA released the Personal Income and Outlays report for January:
Personal income increased $63.0 billion (0.4 percent) in January according to estimates released today by the Bureau of Economic Analysis ... personal consumption expenditures (PCE) increased $22.2 billion (0.2 percent).The January PCE price index increased 1.9 percent year-over-year (compared to 1.6 percent YoY in December) and the January PCE price index, excluding food and energy, increased 1.7 percent year-over-year (same as in December).
...
Real PCE decreased 0.3 percent. The PCE price index increased 0.4 percent. Excluding food and energy, the PCE price index increased 0.3 percent.
The following graph shows real Personal Consumption Expenditures (PCE) through January 2017 (2009 dollars). Note that the y-axis doesn't start at zero to better show the change.
 Click on graph for larger image.
The dashed red lines are the quarterly levels for real PCE.
The increase in personal income was above consensus, and the increase in PCE was below consensus expectations.
MBA: Mortgage Applications Increase in Latest Weekly Survey
by Calculated Risk on 3/01/2017 07:00:00 AM
From the MBA: Mortgage Applications Increase in Latest MBA Weekly Survey
Mortgage applications increased 5.8 percent from one week earlier, according to data from the Mortgage Bankers Association’s (MBA) Weekly Mortgage Applications Survey for the week ending February 24, 2017. This week’s results included an adjustment for the Presidents’ Day holiday.
... The Refinance Index increased 5 percent from the previous week to its highest level since December 2016. The seasonally adjusted Purchase Index increased 7 percent from one week earlier. The unadjusted Purchase Index decreased 1 percent compared with the previous week and was 5 percent lower than the same week one year ago, which did not include the Presidents’ Day holiday.
...
The average contract interest rate for 30-year fixed-rate mortgages with conforming loan balances ($424,100 or less) decreased to 4.30 percent from 4.36 percent, with points increasing to 0.38 from 0.35 (including the origination fee) for 80 percent loan-to-value ratio (LTV) loans.
emphasis added
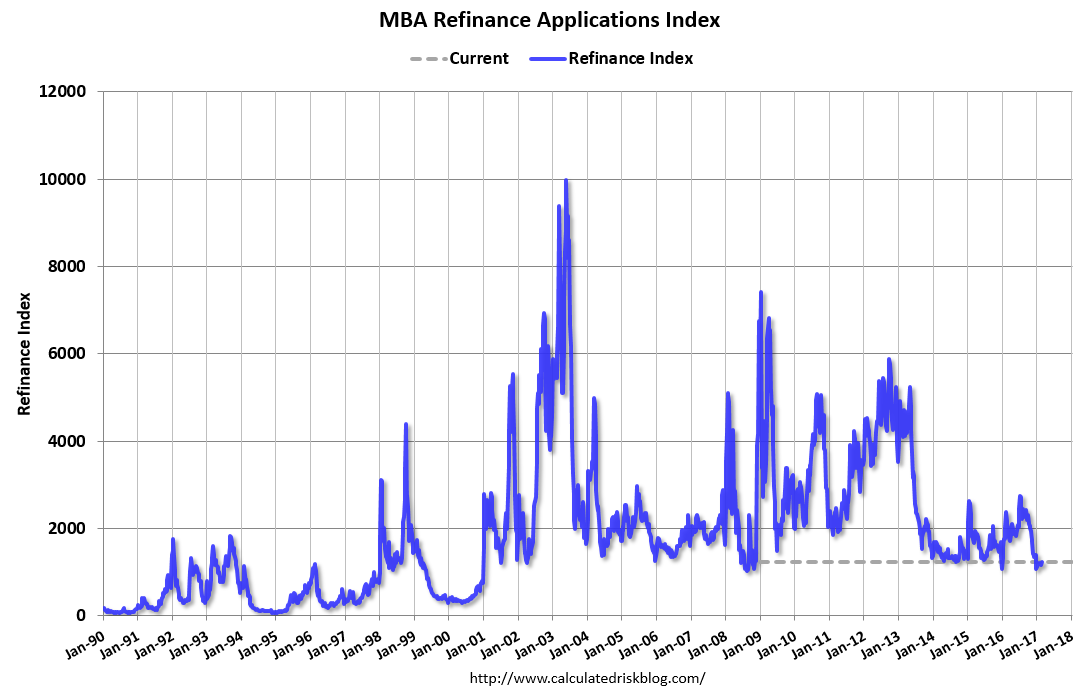 Click on graph for larger image.
The first graph shows the refinance index since 1990.
It would take a substantial decrease in mortgage rates to see a significant increase in refinance activity.
 The second graph shows the MBA mortgage purchase index.
 Even with the recent increase in mortgage rates, purchase activity is still holding up.
However refinance activity has declined significantly since rates increased.


