by Calculated Risk on 2/16/2017 09:02:00 AM
Thursday, February 16, 2017
Weekly Initial Unemployment Claims increase to 239,000
The DOL reported:
In the week ending February 11, the advance figure for seasonally adjusted initial claims was 239,000, an increase of 5,000 from the previous week's unrevised level of 234,000. The 4-week moving average was 245,250, an increase of 500 from the previous week's revised average. The previous week's average was revised up by 500 from 244,250 to 244,750.The previous week was unrevised.
emphasis added
The following graph shows the 4-week moving average of weekly claims since 1971.
 Click on graph for larger image.
The dashed line on the graph is the current 4-week average. The four-week average of weekly unemployment claims increased to 245,250.
This was below the consensus forecast.
The low level of claims suggests relatively few layoffs.
Housing Starts at 1.246 Million Annual Rate in January
by Calculated Risk on 2/16/2017 08:36:00 AM
From the Census Bureau: Permits, Starts and Completions
Housing Starts:
Privately-owned housing starts in January were at a seasonally adjusted annual rate of 1,246,000. This is 2.6 percent below the revised December estimate of 1,279,000, but is 10.5 percent above the January 2016 rate of 1,128,000. Single-family housing starts in January were at a rate of 823,000; this is 1.9 percent above the revised December figure of 808,000. The January rate for units in buildings with five units or more was 421,000.
Building Permits:
Privately-owned housing units authorized by building permits in January were at a seasonally adjusted annual rate of 1,285,000. This is 4.6 percent above the revised December rate of 1,228,000 and is 8.2 percent above the January 2016 rate of 1,188,000. Single-family authorizations in January were at a rate of 808,000; this is 2.7 percent below the revised December figure of 830,000. Authorizations of units in buildings with five units or more were at a rate of 446,000 in January.
emphasis added
 Click on graph for larger image.
The first graph shows single and multi-family housing starts for the last several years.
Multi-family starts (red, 2+ units) decreased in January compared to December. Multi-family starts are up year-over-year.
Multi-family is volatile, and the swings have been huge over the last five months.
Single-family starts (blue) increased in January, and are up 6% year-over-year.
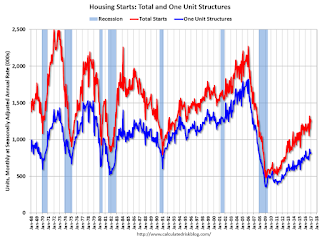
 The second graph shows total and single unit starts since 1968.
 The second graph shows the huge collapse following the housing bubble, and then - after moving sideways for a couple of years - housing is now recovering (but still historically low),
Total housing starts in January were above expectations. Also November and December were revised up sharply. Another solid report. I'll have more later ...
Wednesday, February 15, 2017
Thursday: Housing Starts, Philly Fed Mfg, Q4 Household Debt and Credit
by Calculated Risk on 2/15/2017 08:27:00 PM
From Matthew Graham at Mortgage News Daily: Mortgage Rates Approach 3-Week Highs
Mortgage rates rose for the 5th day in a row following a higher reading in this morning's inflation data and an upbeat Retail Sales report. ... Today's increase brings mortgage rates close to their highest level in 3 weeks. You'd have to go back to January 25th to see worse. That said, "worse" is a relative term. Both then and now, a top tier scenario would result in a conventional 30yr fixed rate of 4.25%. Today's upfront costs would be just slightly lower. Only a few lenders remain at 4.125% on comparable scenarios and several have moved up to 4.375%.Thursday:
emphasis added
• At 8:30 AM, 8:30 AM: Housing Starts for January. The consensus is for 1.232 million, up from the December rate of 1.226 million.
• Also at 8:30 AM, the Philly Fed manufacturing survey for February. The consensus is for a reading of 23.6, up from 19.3.
• At 11:00 AM, The New York Fed will release their Q4 2016 Household Debt and Credit Report
MBA: Mortgage Delinquencies Increased in Q4, Foreclosures Decreased
by Calculated Risk on 2/15/2017 02:56:00 PM
The delinquency rate for mortgage loans on one-to-four-unit residential properties increased to a seasonally adjusted rate of 4.80 percent of all loans outstanding at the end of the fourth quarter of 2016. The delinquency rate was up 28 basis points from the previous quarter, and was three basis points higher than one year ago, according to the Mortgage Bankers Association's (MBA) National Delinquency Survey.
The percentage of loans on which foreclosure actions were started during the fourth quarter was 0.28 percent, a decrease of two basis points from the previous quarter, and eight basis points lower than one year ago. This is the lowest rate of new foreclosures started since the fourth quarter of 1988.
The delinquency rate includes loans that are at least one payment past due but does not include loans in the process of foreclosure. The percentage of loans in the foreclosure process at the end of the fourth quarter was 1.53 percent, down two basis points from the third quarter and 24 basis points lower than one year ago. This was the lowest foreclosure inventory rate since the second quarter of 2007.
The serious delinquency rate, the percentage of loans that are 90 days or more past due or in the process of foreclosure, was 3.13 percent, an increase of 17 basis points from last quarter, and a decrease of 31 basis points from last year.
Marina Walsh, MBA's Vice President of Industry Analysis, offered the following commentary on the survey: "We saw a mixed set of results in the most recent survey. Mortgage delinquencies increased in the fourth quarter for the first time since 2013, while both new foreclosure starts and the percentage of loans in foreclosure continued to decline.
"The overall delinquency rate in the fourth quarter increased across all loan types - FHA, VA and conventional - as compared to the third quarter. However, it should be noted that last quarter's overall delinquency rate was at its lowest level since 2006. It is not unexpected that delinquencies could eventually increase off such a low base. We continue to see strong fundamentals in the overall economy, such as rising home values and increased employment, which bodes well for the future performance of FHA, VA and conventional loans.
emphasis added
 Click on graph for larger image.
This graph shows the percent of loans delinquent by days past due.
Note that the total percent delinquencies and foreclosures is below the 2002 level.
The percent of loans 30 and 60 days delinquent increased in Q4, but is below the normal historical level.
The 90 day bucket increased in Q4, and remains a little elevated.
The percent of loans in the foreclosure process continues to decline, but is still above the historical average.
The 90 day bucket and foreclosure inventory are still elevated, but should be close to normal in 2017. Most other mortgage measures are already back to normal, but the lenders are still working through the backlog of bubble legacy loans.
Key Measures Show Inflation close to 2% in January
by Calculated Risk on 2/15/2017 12:22:00 PM
The Cleveland Fed released the median CPI and the trimmed-mean CPI this morning:
According to the Federal Reserve Bank of Cleveland, the median Consumer Price Index rose 0.3% (3.3% annualized rate) in January. The 16% trimmed-mean Consumer Price Index also rose 0.3% (3.7% annualized rate) during the month. The median CPI and 16% trimmed-mean CPI are measures of core inflation calculated by the Federal Reserve Bank of Cleveland based on data released in the Bureau of Labor Statistics' (BLS) monthly CPI report.Note: The Cleveland Fed released the median CPI details for January here. Motor fuel was up 149% annualized in January!
Earlier today, the BLS reported that the seasonally adjusted CPI for all urban consumers rose 0.6% (6.8% annualized rate) in January. The CPI less food and energy rose 0.3% (3.8% annualized rate) on a seasonally adjusted basis.
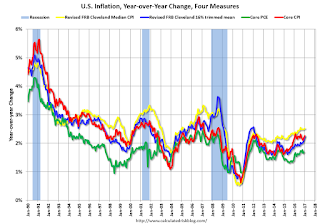
 Click on graph for larger image.
This graph shows the year-over-year change for these four key measures of inflation. On a year-over-year basis, the median CPI rose 2.5%, the trimmed-mean CPI rose 2.2%, and the CPI less food and energy rose 2.3%. Core PCE is for December and increased 1.7% year-over-year.
On a monthly basis, median CPI was at 3.3% annualized, trimmed-mean CPI was at 3.7% annualized, and core CPI was at 3.8% annualized.
Using these measures, inflation has generally been moving up, and most of these measures are above the Fed's 2% target (Core PCE is still below).
NAHB: Builder Confidence decreased to 65 in February
by Calculated Risk on 2/15/2017 10:08:00 AM
The National Association of Home Builders (NAHB) reported the housing market index (HMI) was at 65 in February, down from 67 in January. Any number above 50 indicates that more builders view sales conditions as good than poor.
From NAHB: Builder Confidence Continues to Settle Back to Sustainable Levels in February
Builder confidence in the market for newly-built single-family homes declined two points in February to a level of 65 on the National Association of Home Builders/Wells Fargo Housing Market Index (HMI).
...
“With much of the decline this month resulting from a decrease in buyer traffic, builders continue to struggle to minimize costs while dealing with supply side challenges such as a lack of developed lots and labor shortages,” said NAHB Chief Economist Robert Dietz. “Despite these constraints, the overall housing market fundamentals remain strong and we expect to see continued growth this year as some of these concerns are addressed.”
All three HMI components fell in February. The component gauging current sales conditions dipped one point to 71, and the index charting sales expectations in the next six months registered a three-point decline to 73. The component measuring buyer traffic dropped five points to 46.
Looking at the three-month moving averages for regional HMI scores, the Northeast fell two points to 50 and the Midwest rose one point to 65. The South dipped one point to 67 and the West held steady at 79 for the third month in a row.
emphasis added
 Click on graph for larger image.
This graph show the NAHB index since Jan 1985.
This was below the consensus forecast of 68, but still another solid reading.
Industrial Production decreased 0.3% in January
by Calculated Risk on 2/15/2017 09:22:00 AM
From the Fed: Industrial production and Capacity Utilization
Industrial production decreased 0.3 percent in January following a 0.6 percent increase in December. In January, manufacturing output moved up 0.2 percent, and mining output jumped 2.8 percent. The index for utilities fell 5.7 percent, largely because unseasonably warm weather reduced the demand for heating. At 104.6 percent of its 2012 average, total industrial production in January was at about the same level as it was a year earlier. Capacity utilization for the industrial sector fell 0.3 percentage point in January to 75.3 percent, a rate that is 4.6 percentage points below its long-run (1972–2016) average.
emphasis added
 Click on graph for larger image.
This graph shows Capacity Utilization. This series is up 8.8 percentage points from the record low set in June 2009 (the series starts in 1967).
Capacity utilization at 75.3% is 4.6% below the average from 1972 to 2015 and below the pre-recession level of 80.8% in December 2007.
Note: y-axis doesn't start at zero to better show the change.
 The second graph shows industrial production since 1967.
Industrial production decreased in January to 104.6. This is 19.7% above the recession low, and is close to the pre-recession peak.
This was below expectations of no change, but December was revised up.
Retail Sales increased 0.4% in January
by Calculated Risk on 2/15/2017 08:39:00 AM
On a monthly basis, retail sales increased 0.4 percent from December to January (seasonally adjusted), and sales were up 5.6 percent from January 2016.
From the Census Bureau report:
Advance estimates of U.S. retail and food services sales for January 2017, adjusted for seasonal variation and holiday and trading-day differences, but not for price changes, were $472.1 billion, an increase of 0.4 percent from the previous month, and 5.6 percent above January 2016. ... The November 2016 to December 2016 percent change was revised from up 0.6 percent to up 1.0 percent.
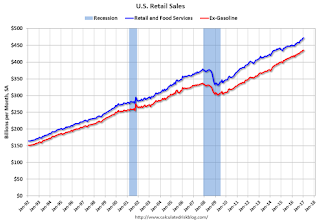
 Click on graph for larger image.
This graph shows retail sales since 1992. This is monthly retail sales and food service, seasonally adjusted (total and ex-gasoline).
Retail sales ex-gasoline were up 0.2% in January.
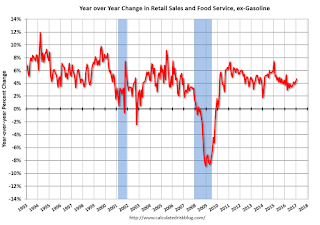
The second graph shows the year-over-year change in retail sales and food service (ex-gasoline) since 1993.
 Retail and Food service sales, ex-gasoline, increased by 4.7% on a YoY basis.
The increase in January was above expectations, and sales for December were revised up. A solid report.
MBA: Mortgage Applications Decrease in Latest Weekly Survey
by Calculated Risk on 2/15/2017 07:00:00 AM
From the MBA: Mortgage Applications Decrease in Latest MBA Weekly Survey
Mortgage applications decreased 3.7 percent from one week earlier, according to data from the Mortgage Bankers Association’s (MBA) Weekly Mortgage Applications Survey for the week ending February 10, 2017.
... The Refinance Index decreased 3 percent from the previous week. The seasonally adjusted Purchase Index decreased 5 percent from one week earlier. The unadjusted Purchase Index increased 1 percent compared with the previous week and was 3 percent higher than the same week one year ago.
...
The average contract interest rate for 30-year fixed-rate mortgages with conforming loan balances ($424,100 or less) decreased to 4.32 percent from 4.35 percent, with points remaining unchanged at 0.34 (including the origination fee) for 80 percent loan-to-value ratio (LTV) loans.
emphasis added
 Click on graph for larger image.
The first graph shows the refinance index since 1990.
It would take a substantial decrease in mortgage rates to see a significant increase in refinance activity - although we might see more cash-out refis.
 The second graph shows the MBA mortgage purchase index.
 Even with the recent increase in mortgage rates, purchase activity is still holding up - and up 3 percent from the same week one year ago.
However refinance activity has declined significantly.
Tuesday, February 14, 2017
Wednesday: Yellen, Retail Sales, CPI, Industrial Production, Homebuilder Confidence, Empire State Mfg
by Calculated Risk on 2/14/2017 07:30:00 PM
Wednesday:
• At 7:00 AM ET, The Mortgage Bankers Association (MBA) will release the results for the mortgage purchase applications index.
• At 8:30 AM, Retail sales for January will be released. The consensus is for 0.1% increase in retail sales in January.
• Also at 8:30 AM, The Consumer Price Index for January from the BLS. The consensus is for 0.3% increase in CPI, and a 0.2% increase in core CPI.
• Also at 8:30 AM, The New York Fed Empire State manufacturing survey for February. The consensus is for a reading of 7.5, up from 6.5.
• At 9:15 AM, The Fed will release Industrial Production and Capacity Utilization for January. The consensus is for no change in Industrial Production, and for Capacity Utilization to be unchanged at 75.5%.
• At 10:00 AM, Testimony by Fed Chair Janet Yellen, Semiannual Monetary Policy Report to the Congress, Before the Committee on Financial Services, U.S. House of Representatives, Washington, D.C.
• Also at 10:00 AM, The February NAHB homebuilder survey. The consensus is for a reading of 68, up from 67 in January. Any number above 50 indicates that more builders view sales conditions as good than poor.
• Also at 10:00 AM, Manufacturing and Trade: Inventories and Sales (business inventories) report for December. The consensus is for a 0.4% increase in inventories.


