 RSS Feed
 by Calculated Risk on 9/22/2016 07:00:00 AM
Thursday, September 22, 2016
Black Knight: Mortgage Delinquencies declined in August
From Black Knight: Black Knight’s First Look at August 2016 Mortgage Data: Prepayments Skyrocket, Fueled by Post-‘Brexit’ Activity, Hit Highest Single-Month Rate in Over Three Years
• Monthly prepayment rate (historically a good indicator of refinance activity) increased by 32 percent month-over-monthNote: the "spike" in delinquencies in July was seasonal.
• August’s prepayment rate of 1.67 percent is the highest Single Month Mortality (SMM) rate in over three years
• Delinquencies fully recovered from July’s spike, falling 6 percent (-135,000) from one month ago
• Inventory of loans in foreclosure has now declined for 19 consecutive months -- and 51 of the past 52 months
According to Black Knight's First Look report for August, the percent of loans delinquent decreased 6.0% in August compared to July, and declined 11.4% year-over-year.
The percent of loans in the foreclosure process declined 4.3% in August and were down 29.9% over the last year.
Black Knight reported the U.S. mortgage delinquency rate (loans 30 or more days past due, but not in foreclosure) was 4.24% in August, down from 4.51% in July.
The percent of loans in the foreclosure process declined in August to 1.04%.
The number of delinquent properties, but not in foreclosure, is down 262,000 properties year-over-year, and the number of properties in the foreclosure process is down 221,000 properties year-over-year.
Black Knight will release the complete mortgage monitor for August on October 3rd.
| Black Knight: Percent Loans Delinquent and in Foreclosure Process | ||||
|---|---|---|---|---|
| Aug 2016 | July 2016 | Aug 2015 | Aug 2014 | |
| Delinquent | 4.24% | 4.51% | 4.87% | 5.93% |
| In Foreclosure | 1.04% | 1.09% | 1.48% | 1.92% |
| Number of properties: | ||||
| Number of properties that are delinquent, but not in foreclosure: | 2,151,000 | 2,286,000 | 2,413,000 | 2,985,000 |
| Number of properties in foreclosure pre-sale inventory: | 527,000 | 550,000 | 748,000 | 970,000 |
| Total Properties | 2,678,000 | 2,836,000 | 3,161,000 | 3,955,000 |
Wednesday, September 21, 2016
Merrill: "Fed signals December hike"
by Calculated Risk on 9/21/2016 06:46:00 PM
This is now the consensus view - one rate hike in 2016, most likely in December (but the November meeting is "live") ... From Merrill Lynch: Fed signals December hike
The FOMC clearly signaled a hike before the end of the year in both the language and the dots. The Fed made two important changes to the statement. First, the committee noted that near-term risks to the economic outlook “appear roughly balanced”. This is an important step for the Fed to justify hiking rates at an upcoming meeting and is a page out of the playbook from last year. ...Thursday:
Second, the FOMC noted that “the Committee judges that the case for an increase in the federal funds rate has strengthened but decided, for the time being, to wait for further evidence of further progress toward its objectives.” This is a strong signal that the Fed is planning to hike in an upcoming meeting. It is not explicit calendar guidance, but it is a small step in that direction.
emphasis added
• At 8:30 AM ET, The initial weekly unemployment claims report will be released. The consensus is for 261 thousand initial claims, up from 260 thousand the previous week.
• Also at 8:30 AM, Chicago Fed National Activity Index for August. This is a composite index of other data.
• At 9:00 AM, FHFA House Price Index for July 2016. This was originally a GSE only repeat sales, however there is also an expanded index. The consensus is for a 0.4% month-to-month increase for this index.
• At 10:00 AM, Existing Home Sales for August from the National Association of Realtors (NAR). The consensus is for 5.44 million SAAR, up from 5.39 million in July. Housing economist Tom Lawler expects the NAR to report sales of 5.49 million SAAR in August, up 1.9% from July’s preliminary pace.
FOMC Projections and Press Conference Link
by Calculated Risk on 9/21/2016 02:10:00 PM
Statement here. No change to policy.
As far as the "Appropriate timing of policy firming", participants generally think that rates will be at 0.625% by the end of the year.
The FOMC projections for inflation are still on the low side through 2018.
Yellen press conference video here.
On the projections, GDP was revised down for 2016.
| GDP projections of Federal Reserve Governors and Reserve Bank presidents | ||||
|---|---|---|---|---|
| Change in Real GDP1 | 2016 | 2017 | 2018 | 2019 |
| Sept 2016 | 1.7 to 1.9 | 1.9 to 2.2 | 1.9 to 2.2 | 1.7 to 2.0 |
| Jun 2016 | 1.9 to 2.0 | 1.9 to 2.2 | 1.8 to 2.1 | n.a. |
The unemployment rate was at 4.9% in August, and the unemployment rate projection for Q4 2016 was revised up slightly.
| Unemployment projections of Federal Reserve Governors and Reserve Bank presidents | ||||
|---|---|---|---|---|
| Unemployment Rate2 | 2016 | 2017 | 2018 | 2019 |
| Sept 2016 | 4.7 to 4.9 | 4.5 to 4.7 | 4.4 to 4.7 | 4.4 to 4.8 |
| Jun 2016 | 4.6 to 4.8 | 4.5 to 4.7 | 4.4 to 4.8 | n.a. |
As of July, PCE inflation was up only 0.8% from July 2015.
| Inflation projections of Federal Reserve Governors and Reserve Bank presidents | ||||
|---|---|---|---|---|
| PCE Inflation1 | 2016 | 2017 | 2018 | 2019 |
| Sept 2016 | 1.2 to 1.4 | 1.7 to 1.9 | 1.8 to 2.0 | 1.9 to 2.0 |
| Jun 2016 | 1.3 to 1.7 | 1.7 to 2.0 | 1.9 to 2.0 | n.a. |
PCE core inflation was up 1.6% in July year-over-year. Core PCE inflation was unrevised for 2016.
| Core Inflation projections of Federal Reserve Governors and Reserve Bank presidents | ||||
|---|---|---|---|---|
| Core Inflation1 | 2016 | 2017 | 2018 | 2019 |
| Sept 2016 | 1.6 to 1.8 | 1.7 to 1.9 | 1.8 to 2.0 | 1.9 to 2.0 |
| Jun 2016 | 1.6 to 1.8 | 1.7 to 2.0 | 1.9 to 2.0 | n.a. |
FOMC Statement: No Change to Policy, "The case for an increase in the federal funds rate has strengthened"
by Calculated Risk on 9/21/2016 02:02:00 PM
Preparing for a rate hike soon ...
FOMC Statement:
Information received since the Federal Open Market Committee met in July indicates that the labor market has continued to strengthen and growth of economic activity has picked up from the modest pace seen in the first half of this year. Although the unemployment rate is little changed in recent months, job gains have been solid, on average. Household spending has been growing strongly but business fixed investment has remained soft. Inflation has continued to run below the Committee's 2 percent longer-run objective, partly reflecting earlier declines in energy prices and in prices of non-energy imports. Market-based measures of inflation compensation remain low; most survey-based measures of longer-term inflation expectations are little changed, on balance, in recent months.
Consistent with its statutory mandate, the Committee seeks to foster maximum employment and price stability. The Committee expects that, with gradual adjustments in the stance of monetary policy, economic activity will expand at a moderate pace and labor market conditions will strengthen somewhat further. Inflation is expected to remain low in the near term, in part because of earlier declines in energy prices, but to rise to 2 percent over the medium term as the transitory effects of past declines in energy and import prices dissipate and the labor market strengthens further. Near-term risks to the economic outlook appear roughly balanced. The Committee continues to closely monitor inflation indicators and global economic and financial developments.
Against this backdrop, the Committee decided to maintain the target range for the federal funds rate at 1/4 to 1/2 percent. The Committee judges that the case for an increase in the federal funds rate has strengthened but decided, for the time being, to wait for further evidence of continued progress toward its objectives. The stance of monetary policy remains accommodative, thereby supporting further improvement in labor market conditions and a return to 2 percent inflation.
In determining the timing and size of future adjustments to the target range for the federal funds rate, the Committee will assess realized and expected economic conditions relative to its objectives of maximum employment and 2 percent inflation. This assessment will take into account a wide range of information, including measures of labor market conditions, indicators of inflation pressures and inflation expectations, and readings on financial and international developments. In light of the current shortfall of inflation from 2 percent, the Committee will carefully monitor actual and expected progress toward its inflation goal. The Committee expects that economic conditions will evolve in a manner that will warrant only gradual increases in the federal funds rate; the federal funds rate is likely to remain, for some time, below levels that are expected to prevail in the longer run. However, the actual path of the federal funds rate will depend on the economic outlook as informed by incoming data.
The Committee is maintaining its existing policy of reinvesting principal payments from its holdings of agency debt and agency mortgage-backed securities in agency mortgage-backed securities and of rolling over maturing Treasury securities at auction, and it anticipates doing so until normalization of the level of the federal funds rate is well under way. This policy, by keeping the Committee's holdings of longer-term securities at sizable levels, should help maintain accommodative financial conditions.
Voting for the FOMC monetary policy action were: Janet L. Yellen, Chair; William C. Dudley, Vice Chairman; Lael Brainard; James Bullard; Stanley Fischer; Jerome H. Powell; and Daniel K. Tarullo. Voting against the action were: Esther L. George, Loretta J. Mester, and Eric Rosengren, each of whom preferred at this meeting to raise the target range for the federal funds rate to 1/2 to 3/4 percent.
emphasis added
AIA: Architecture Billings Index declines in August
by Calculated Risk on 9/21/2016 09:57:00 AM
Note: This index is a leading indicator primarily for new Commercial Real Estate (CRE) investment.
From the AIA: Architecture Billings Index slips, overall outlook remains positive
On the heels of six out of seven months of increasing levels of demand for design services, the Architecture Billings Index (ABI) fell just below the positive mark. As a leading economic indicator of construction activity, the ABI reflects the approximate nine to twelve month lead time between architecture billings and construction spending. The American Institute of Architects (AIA) reported the August ABI score was 49.7, down from the mark of 51.5 in the previous month. This score reflects a decrease in design services (any score above 50 indicates an increase in billings). The new projects inquiry index was 61.8, up sharply from a reading of 57.5 the previous month.Note that multi-family is positive again, so we might see another pickup in multi-family starts.
“This is only the second month this year where demand for architectural services has declined and it is only by a fraction of a point,” said AIA Chief Economist, Kermit Baker, Hon. AIA, PhD. “Given the solid numbers for new design contracts and project inquiries, it doesn’t appear that this is the beginning of a broader downturn in the design and construction industry.”
...
• Regional averages: South (55.2), Midwest (52.8), West (49.0), Northeast (44.9)
• Sector index breakdown: mixed practice (51.8), multi-family residential (50.9), commercial / industrial (50.8), institutional (50.7)
emphasis added
 Click on graph for larger image.
This graph shows the Architecture Billings Index since 1996. The index was at 49.7 in August, down from 51.5 in July. Anything above 50 indicates expansion in demand for architects' services.
Note: This includes commercial and industrial facilities like hotels and office buildings, multi-family residential, as well as schools, hospitals and other institutions.
According to the AIA, there is an "approximate nine to twelve month lag time between architecture billings and construction spending" on non-residential construction. This index was positive in 9 of the last 12 months, suggesting a further increase in CRE investment through mid-2017.
MBA: "Mortgage Applications Decrease in Latest Weekly Survey"
by Calculated Risk on 9/21/2016 07:00:00 AM
From the MBA: Mortgage Applications Decrease in Latest MBA Weekly Survey
Mortgage applications decreased 7.3 percent from one week earlier, according to data from the Mortgage Bankers Association’s (MBA) Weekly Mortgage Applications Survey for the week ending September 16, 2016. The prior week’s results included an adjustment for the Labor Day holiday.
... The Refinance Index decreased 8 percent from the previous week to the lowest level since June 2016. The seasonally adjusted Purchase Index decreased 7 percent from one week earlier. The unadjusted Purchase Index increased 15 percent compared with the previous week and was 3 percent higher than the same week one year ago.
...
The average contract interest rate for 30-year fixed-rate mortgages with conforming loan balances ($417,000 or less) increased to its highest level since June 2016, 3.70 percent, from 3.67 percent, with points increasing to 0.38 from 0.36 (including the origination fee) for 80 percent loan-to-value ratio (LTV) loans.
emphasis added
 Click on graph for larger image.
The first graph shows the refinance index since 1990.
Refinance activity has increased this year since rates have declined.
Last week I noted "Based on the increase in mortgage rates over the last few days, I'd expect refinance activity to decline soon", and it looks like activity is now declining. Rates would have to take another step down to see a pickup in refinance activity.
 The second graph shows the MBA mortgage purchase index.
 The purchase index is only "3 percent higher than the same week one year ago".
Tuesday, September 20, 2016
Wednesday: FOMC Announcement
by Calculated Risk on 9/20/2016 07:54:00 PM
Here is a Review of FOMC Projections
And a few excerpts from a piece by Goldman Sachs economists Zach Pandl and Jan Hatzius: FOMC Preview: How Much Is Really a-Changin?
[W]e now see very low chances of a rate increase ... By our count, seven FOMC participants would prefer to raise the funds rate next week, and two seem to be leaning that way. In these situations, the FOMC will often use the post-meeting statement to help forge a compromise. We should therefore expect a more hawkish tone in the statement and press conference.Wednesday:
While we expect some tough talk, our best guess is that the statement will be sufficiently noncommittal to keep markets unsure about the prospects of a rate hike this year—in part because the timing of the November meeting limits the committee’s ability to provide very strong signals. Shifting to a “nearly balanced” risk assessment could keep markets on notice, but this phrasing has been absent since December, possibly reflecting Chair Yellen’s own preferences. It’s a close call, but we think the committee will probably use different language.
In the Summary of Economic Projections (SEP), we look for lower GDP growth for this year and a reduction in the longer-run estimate. Projections for unemployment and core inflation will likely be unchanged. Reflecting the discussion among policymakers about low equilibrium rates, we expect the “dot plot” to show a slower pace of funds rate increases over the coming years, with the 2017 and 2018 median dots falling by 50bp—though this is also a close call.
• At 7:00 AM ET, The Mortgage Bankers Association (MBA) will release the results for the mortgage purchase applications index.
• During the day, The AIA's Architecture Billings Index for August (a leading indicator for commercial real estate).
• At 2:00 PM, the FOMC Meeting Announcement. No change to the Fed Funds rate is expected at this meeting.
• Also at 2:00 PM, FOMC Forecasts This will include the Federal Open Market Committee (FOMC) participants' projections of the appropriate target federal funds rate along with the quarterly economic projections.
• At 2:30 PM, Fed Chair Janet Yellen holds a press briefing following the FOMC announcement.
Look Back: In 2006 I predicted House Prices would fall 40%+ in the Bay Area
by Calculated Risk on 9/20/2016 03:42:00 PM
A reader asked about an old (and I suppose bold at the time) prediction ...
In 2006 I wrote Bay Area: How far will prices fall?
In the comments to the previous post I suggested that Bay Area prices might fall 40%+ in real terms over 5 to 7 years. ac asked how I came up with that estimate, and Lester suggested somewhat impolitely that the estimate did not match my "moderate, professorial tone".So how far did prices fall?
According to Case-Shiller, prices in San Francisco peaked in March 2006 with the index at 219.31. Prices bottomed in San Francisco in May of 2009 at 119.97. That was a nominal decline of 45% (real of 50%), however in a shorter period than I expected - probably because of the boom in tech. Most areas bottomed in early 2012 (the expected 5 to 7 years).
Other areas of the Bay Area probably did worse.
As I noted in 2006, I predicted the price decline based on previous housing busts, and factored in the larger bubble.
But what have I done lately? Nothing bold, unless this counts. I think we can agree those recession calls were incorrect.
Comments on August Housing Starts
by Calculated Risk on 9/20/2016 12:59:00 PM
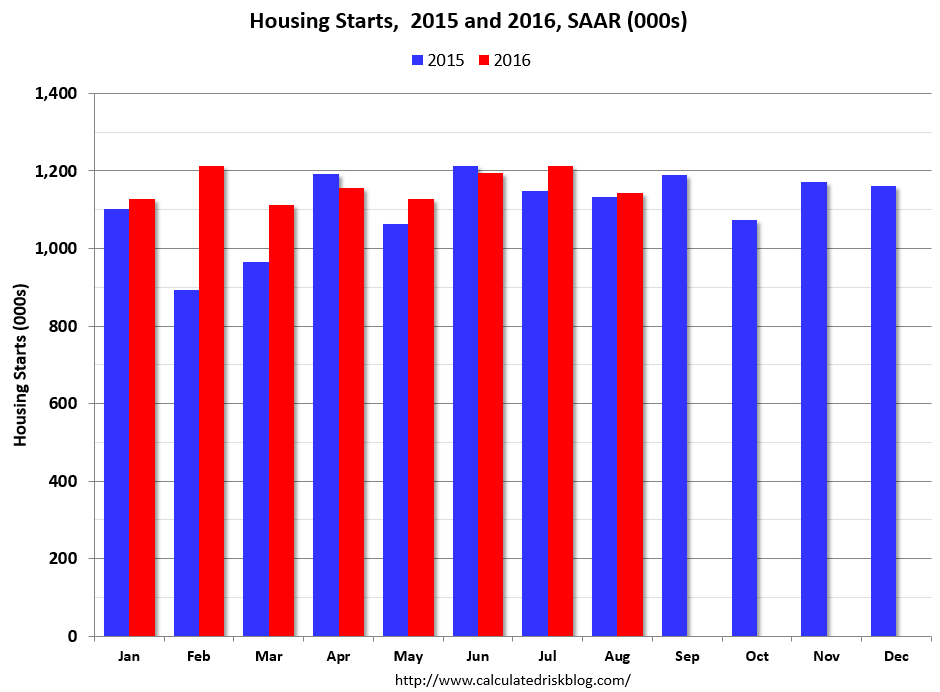
Earlier: Housing Starts increased to 1.142 Million Annual Rate in August
The housing starts report this morning was below consensus, however there were upward revisions to the prior two months.
This first graph shows the month to month comparison between 2015 (blue) and 2016 (red).
 Click on graph for larger image.
Year-to-date starts are up 6.1% compared to the same period in 2015. My guess was starts would increase 4% to 8% in 2016, and that still looks about right.
Multi-family starts are up 0.3% year-to-date, and single-family starts are up 9.1% year-to-date.
Below is an update to the graph comparing multi-family starts and completions. Since it usually takes over a year on average to complete a multi-family project, there is a lag between multi-family starts and completions. Completions are important because that is new supply added to the market, and starts are important because that is future new supply (units under construction is also important for employment).
These graphs use a 12 month rolling total for NSA starts and completions.
 The blue line is for multifamily starts and the red line is for multifamily completions.
The rolling 12 month total for starts (blue line) increased steadily over the last few years, and completions (red line) have lagged behind - but completions have been catching up (more deliveries, although this has dipped lately). Completions lag starts by about 12 months.
I think most of the growth in multi-family starts is probably behind us - in fact multi-family starts probably peaked in June 2015 (at 510 thousand SAAR) - although I expect solid multi-family starts for a few more years (based on demographics).
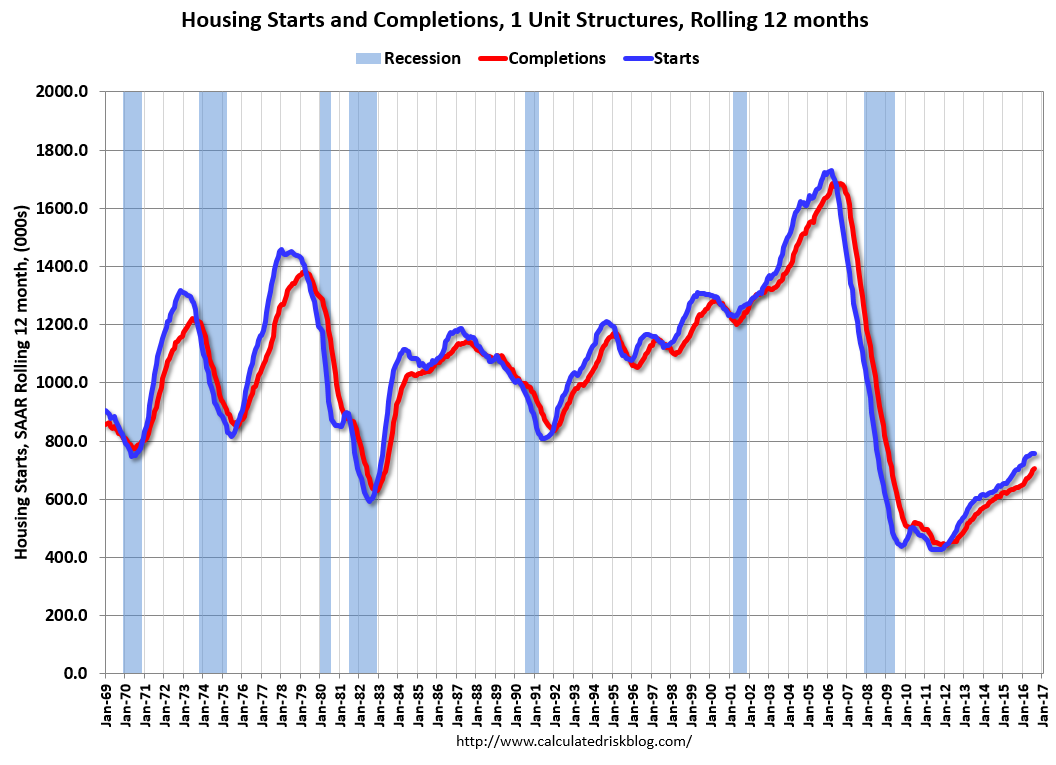 The second graph shows single family starts and completions. It usually only takes about 6 months between starting a single family home and completion - so the lines are much closer. The blue line is for single family starts and the red line is for single family completions.
Note the exceptionally low level of single family starts and completions. The "wide bottom" was what I was forecasting several years ago, and now I expect several years of increasing single family starts and completions.
BLS: Unemployment Rates stable in 41 states in August
by Calculated Risk on 9/20/2016 10:12:00 AM
From the BLS: Regional and State Employment and Unemployment Summary
Unemployment rates were significantly higher in August in 6 states, lower in 3 states, and stable in 41 states and the District of Columbia, the U.S. Bureau of Labor Statistics reported today.
...
South Dakota and New Hampshire had the lowest jobless rates in August, 2.9 percent and 3.0 percent, respectively. Alaska had the highest unemployment rate, 6.8 percent.
emphasis added
 Click on graph for larger image.
This graph shows the current unemployment rate for each state (red), and the max during the recession (blue). All states are well below the maximum unemployment rate for the recession.
The size of the blue bar indicates the amount of improvement. The yellow squares are the lowest unemployment rate per state since 1976.
The states are ranked by the highest current unemployment rate. Alaska, at 6.8%, had the highest state unemployment rate.
 The second graph shows the number of states (and D.C.) with unemployment rates at or above certain levels since January 2006. At the worst of the employment recession, there were 11 states with an unemployment rate at or above 11% (red).
Currently no state has an unemployment rate at or above 7% (light blue); Only five states and D.C are at or above 6% (dark blue). The states are Alaska (6.8%), New Mexico (6.6%), Louisiana (6.3%), Nevada (6.3%), D.C. (6.0%), and Mississippi (6.0%).


