 RSS Feed
 by Calculated Risk on 8/27/2016 08:09:00 AM
Saturday, August 27, 2016
Schedule for Week of Aug 28, 2016
The key report this week is the August employment report on Friday.
Other key indicators include Personal Income and Outlays for July, the Case-Shiller House Price Index for June, the August ISM manufacturing and non-manufacturing indexes, August auto sales, and the July trade deficit.
8:30 AM: Personal Income and Outlays for July. The consensus is for a 0.4% increase in personal income, and for a 0.3% increase in personal spending. And for the Core PCE price index to increase 0.1%.
10:30 AM ET: Dallas Fed Survey of Manufacturing Activity for August.
 9:00 AM: S&P/Case-Shiller House Price Index for June. Although this is the June report, it is really a 3 month average of April, May and June prices.
This graph shows the nominal seasonally adjusted National Index, Composite 10 and Composite 20 indexes through the May 2016 report (the Composite 20 was started in January 2000).
The consensus is for a 5.2% year-over-year increase in the Comp 20 index for June. The Zillow forecast is for the National Index to increase 5.1% year-over-year in June.
7:00 AM ET: The Mortgage Bankers Association (MBA) will release the results for the mortgage purchase applications index.
8:15 AM: The ADP Employment Report for August. This report is for private payrolls only (no government). The consensus is for 175,000 payroll jobs added in August, down from 179,000 added in July.
9:45 AM: Chicago Purchasing Managers Index for August. The consensus is for a reading of 55.2, down from 55.8 in July.
10:00 AM: Pending Home Sales Index for July. The consensus is for a 0.6% increase in the index.
8:30 AM ET: The initial weekly unemployment claims report will be released. The consensus is for 265 thousand initial claims, up from 261 thousand the previous week.
 10:00 AM: ISM Manufacturing Index for August. The consensus is for the ISM to be at 52.2, down from 52.6 in July.
Here is a long term graph of the ISM manufacturing index.
The ISM manufacturing index indicated expansion at 52.6% in July. The employment index was at 49.4%, and the new orders index was at 56.9%.
10:00 AM: Construction Spending for July. The consensus is for a 0.6% increase in construction spending.
 All day: Light vehicle sales for August. The consensus is for light vehicle sales to decrease to 17.1 million SAAR in August, from 17.8 million in July (Seasonally Adjusted Annual Rate).
This graph shows light vehicle sales since the BEA started keeping data in 1967. The dashed line is the July sales rate.
8:30 AM: Employment Report for August. The consensus is for an increase of 175,000 non-farm payroll jobs added in August, down from the 255,000 non-farm payroll jobs added in July.
The consensus is for the unemployment rate to decrease to 4.8%.
 This graph shows the year-over-year change in total non-farm employment since 1968.
In July, the year-over-year change was 2.45 million jobs.
A key will be the change in wages.
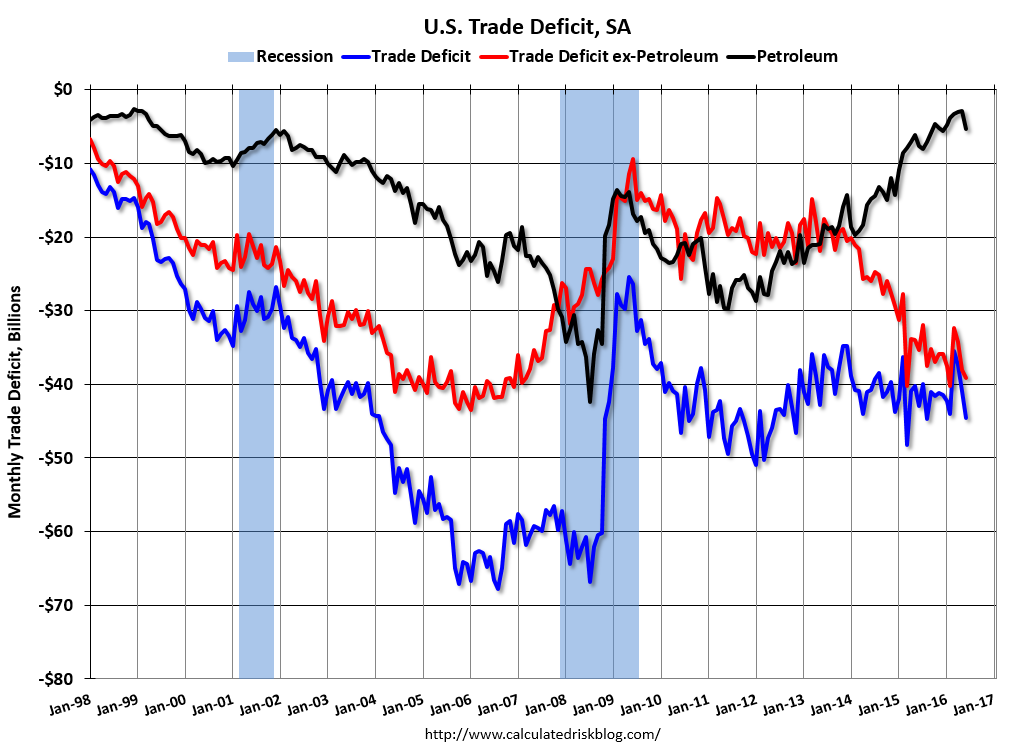 8:30 AM: Trade Balance report for July from the Census Bureau.
 This graph shows the U.S. trade deficit, with and without petroleum, through June. The blue line is the total deficit, and the black line is the petroleum deficit, and the red line is the trade deficit ex-petroleum products.
The consensus is for the U.S. trade deficit to be at $41.3 billion in July from $44.5 billion in June.
10:00 AM: Manufacturers' Shipments, Inventories and Orders (Factory Orders) for July. The consensus is a 2.0% increase in orders.
Friday, August 26, 2016
August 2016: Unofficial Problem Bank list declines to 184 Institutions
by Calculated Risk on 8/26/2016 07:49:00 PM
This is an unofficial list of Problem Banks compiled only from public sources.
Here is the unofficial problem bank list for August 2016.
Changes and comments from surferdude808:
Update on the Unofficial Problem Bank List for August 2016. During the month, the list declined by a net 12 institutions from 196 to 184. The net change of 12 institutions results from 14 removals and two additions. Assets dropped by $2.3 billion to an aggregate $56.5 billion, with $350 million of the decline coming from updated figures for the second quarter. A year ago, the list held 282 institutions with assets of $82.7 billion. This week, we were anticipating for the FDIC to release second quarter industry results and an update on the Official Problem Bank List, but that will have to wait until next month's update.
Actions have been terminated against SpiritBank, Tulsa, OK ($767 million); Tennessee State Bank, Pigeon Forge, TN ($641 million); First American State Bank, Greenwood Village, CO ($279 million); First National Bank, Camdenton, MO ($206 million); Cornerstone Bank, Overland Park, KS ($159 million); Friends Bank, New Smyrna Beach, FL ($104 million Ticker: FRIE); New Jersey Community Bank, Freehold, NJ ($103 million); GSL Savings Bank, Guttenberg, NJ ($91 million); RepublicBankAZ, N.A., Phoenix, AZ ($90 million); and FirstSecure Bank and Trust Co., Palos Hills, IL ($61 million).
Several banks merged to find their way off the problem bank list including Hopkins Federal Savings Bank, Baltimore, MD ($229 million); Harvard Savings Bank, Harvard, IL ($142 million); and The Bank of Oswego, Lake Oswego, OR ($61 million).
In the very hard to believe category, another bank headquartered in Georgia -- The Woodbury Banking Company, Woodbury, GA ($22 million) – found its way off the list through failure. Since the on-set of the Great Recession, 91 institutions headquartered in Georgia have failed. Of the 352 institutions open at year-end 2007 in Georgia, 91 or nearly 26 percent have failed, which is more than four times the national failure rate of 6 percent. It begs the question, how is it possible for there to be any banks left in the state that could fail.
Nationwide, since the on-set of the Great Recession, 533 institutions with assets of nearly $4 trillion have failed or received open-bank assistance. To put this in context, there were 8,544 institutions with assets of $13.1 trillion open in the U.S. at year-end 2007. Thus, 6.2 percent of institutions that held 30.3 percent of assets have failed or received open-bank assistance. In comparison, from 1980 through 1994, a period most consider as the most severe banking crisis since the Great Depression, 9.1% of institutions holding nearly 9.0% of assets failed or received open-bank assistance. So while the failure rate is lower in this episode, the share of assets is significantly greater. In the 1990s, the FDIC produced comprehensive research (“History of the Eighties”) to understand the causes of that crisis and identify ways to limit a future crisis. In response, FDIC Chairman Ricki Helfer spearheaded the formation of a new division to identify emerging systemic risks in the industry. In a 1996 speech, FDIC Chairman Helfer said “Neither we nor the industry we supervise can afford being so wrong again. The speed of technology and the rapid innovations in the marketplace mean that trouble could come quickly and in large numbers. We need to avoid being that wrong again by monitoring trends more broadly and taking specific action on the information we receive.” But somehow the FDIC’s division designed specifically to identify a widespread banking crisis got it way wrong. The lack of a major research effort by the FDIC to understand what went wrong in this current episode should be concerning to all industry observers.
Vehicle Sales Forecast: Sales to Weaken in August, Still Around 17 Million SAAR
by Calculated Risk on 8/26/2016 03:40:00 PM
The automakers will report August vehicle sales on Thursday, Sept 1st.
Note: There were 26 selling days in August, the same as in August 2015.
From WardsAuto: Forecast: U.S. Light Vehicles Sales Weaken in August
A WardsAuto forecast calls for August U.S. light-vehicle sales to reach a 17.4 million-unit seasonally adjusted annual rate, less than like-2015’s 17.7 million and July’s 17.8 million, but ahead of the 17.2 million recorded over the first seven months of this year.From J.D. Power: August Decline in New-Vehicle Sales Fourth in Last Six Months
emphasis added
The SAAR for total sales is projected at 16.8 million units in August 2016, down from 17.7 million units a year ago.Vehicle sales are moving more sideways now.
Comments on Home Sales in July
by Calculated Risk on 8/26/2016 11:59:00 AM
CR Note: When the New and Existing home sales reports were released this week, I was out of town and didn't post any graphs. Here are a few graphs and comments on the reports.
The new home sales report for July was very strong at 654,000 on a seasonally adjusted annual rate basis (SAAR) - the highest since October 2007 - however combined sales for April, May and June were revised down by 12 thousand SAAR.
Sales were up 31.3% year-over-year (YoY) compared to July 2015. And sales are up 12.4% year-to-date compared to the same period in 2015.
 Click on graph for larger image.
The first graph shows New Home Sales vs. recessions since 1963. The dashed line is the current sales rate.
As always, I wouldn't read too much into data for any one month - this series is volatile and the revisions are frequently significant.
However it does appear new home sales are approaching normal levels (I've been expecting sales to increase to at least 800 thousand - but I expected the recovery to be slow).
 The second graph shows new home sales for 2015 and 2016 by month (Seasonally Adjusted Annual Rate). Sales to date are up 12.4% year-over-year, mostly because of the solid growth starting in Q2.
There will probably be solid year-over-year growth in Q3 this year too.
Overall I expected lower growth this year, in the 4% to 8% range. Slower growth seemed likely this year because Houston (and other oil producing areas) will have a problem this year.
So far new home sales have been stronger than my forecast.
 The third graph shows existing home sales, on a Seasonally Adjusted Annual Rate (SAAR) basis since 1993.
Sales in July (5.39 million SAAR) were 3.2% lower than last month, and were 1.6% below the July 2015 rate.
For existing homes, inventory is still key. I expected some increase in inventory last year, but that didn't happened. Inventory is still very low and falling year-over-year (down 5.8% year-over-year in June). More inventory would probably mean smaller price increases and slightly higher sales, and less inventory means lower sales and somewhat larger price increases.
Two of the key reasons inventory is low: 1) A large number of single family home and condos were converted to rental units. Last year, housing economist Tom Lawler estimated there were 17.5 million renter occupied single family homes in the U.S., up from 10.7 million in 2000. Many of these houses were purchased by investors, and rents have increased substantially, and the investors are not selling (even though prices have increased too). Most of these rental conversions were at the lower end, and that is limiting the supply for first time buyers. 2) Baby boomers are aging in place (people tend to downsize when they are 75 or 80, in another 10 to 20 years for the boomers). Instead we are seeing a surge in home improvement spending, and this is also limiting supply.
And here is another update to the "distressing gap" graph that I first started posting a number of years ago to show the emerging gap caused by distressed sales. Now I'm looking for the gap to close over the next several years.
 The "distressing gap" graph shows existing home sales (left axis) and new home sales (right axis) through July 2016. This graph starts in 1994, but the relationship had been fairly steady back to the '60s.
Following the housing bubble and bust, the "distressing gap" appeared mostly because of distressed sales.
I expect existing home sales to move more sideways, and I expect this gap to slowly close, mostly from an increase in new home sales.
However, this assumes that the builders will offer some smaller, less expensive homes. If not, then the gap will persist.
 Another way to look at this is a ratio of existing to new home sales.
This ratio was fairly stable from 1994 through 2006, and then the flood of distressed sales kept the number of existing home sales elevated and depressed new home sales. (Note: This ratio was fairly stable back to the early '70s, but I only have annual data for the earlier years).
In general the ratio has been trending down, and this ratio will probably continue to trend down over the next several years.
Note: Existing home sales are counted when transactions are closed, and new home sales are counted when contracts are signed. So the timing of sales is different.
Yellen: "Case for an increase in the federal funds rate has strengthened"
by Calculated Risk on 8/26/2016 10:09:00 AM
From Fed Chair Janet Yellen: The Federal Reserve's Monetary Policy Toolkit: Past, Present, and Future. Excerpt:
Looking ahead, the FOMC expects moderate growth in real gross domestic product (GDP), additional strengthening in the labor market, and inflation rising to 2 percent over the next few years. Based on this economic outlook, the FOMC continues to anticipate that gradual increases in the federal funds rate will be appropriate over time to achieve and sustain employment and inflation near our statutory objectives. Indeed, in light of the continued solid performance of the labor market and our outlook for economic activity and inflation, I believe the case for an increase in the federal funds rate has strengthened in recent months. Of course, our decisions always depend on the degree to which incoming data continues to confirm the Committee's outlook.
...
And, as ever, the economic outlook is uncertain, and so monetary policy is not on a preset course. Our ability to predict how the federal funds rate will evolve over time is quite limited because monetary policy will need to respond to whatever disturbances may buffet the economy. In addition, the level of short-term interest rates consistent with the dual mandate varies over time in response to shifts in underlying economic conditions that are often evident only in hindsight. For these reasons, the range of reasonably likely outcomes for the federal funds rate is quite wide ...
emphasis added
Q2 GDP Revised Down to 1.1% Annual Rate
by Calculated Risk on 8/26/2016 08:33:00 AM
From the BEA: Gross Domestic Product: Second Quarter 2016 (Second Estimate)
Real gross domestic product increased at an annual rate of 1.1 percent in the second quarter of 2016, according to the "second" estimate released by the Bureau of Economic Analysis. In the first quarter, real GDP increased 0.8 percent.Here is a Comparison of Second and Advance Estimates. PCE growth was revised up from 4.2% to 4.4%. (Solid PCE). Residential investment was revised down from -6.1% to -7.7%. This was close to the consensus forecast.
The GDP estimate released today is based on more complete source data than were available for the "advance" estimate issued last month. In the advance estimate, the increase in real GDP was 1.2 percent. With this second estimate for the second quarter, the general picture of economic growth remains the same; revisions to the components of GDP are small ...
emphasis added
Thursday, August 25, 2016
Friday: Yellen, GDP
by Calculated Risk on 8/25/2016 08:32:00 PM
Yellen time updated (ht SBG)
CR Note: It was an awesome trip, but it is great to be home. I'll be posting some catch-up graphs and comments on new and existing home sales tomorrow. Best to All.
Friday:
• At 8:30 AM ET, Gross Domestic Product, 2nd quarter 2016 (Second estimate). The consensus is that real GDP increased 1.1% annualized in Q2, down from 1.2% in the advance estimate.
• At 10:00 AM, Fed Chair Janet Yellen will speak at the annual economic symposium in Jackson Hole, Wyoming. The symposium topic is “Designing Resilient Monetary Policy Frameworks for the Future”.
• At 10:00 AM, University of Michigan's Consumer sentiment index (final for August). The consensus is for a reading of 90.5, up from the preliminary reading 90.4.
Back in Town, Earlier: Weekly Initial Unemployment Claims decreased to 262,000
by Calculated Risk on 8/25/2016 05:39:00 PM
CR Note: I'm back from NYC. Had a great time!
The DOL reported:
In the week ending August 20, the advance figure for seasonally adjusted initial claims was 261,000, a decrease of 1,000 from the previous week's unrevised level of 262,000. The 4-week moving average was 264,000, a decrease of 1,250 from the previous week's unrevised average of 265,250.The previous week was unrevised.
There were no special factors impacting this week's initial claims. This marks 77 consecutive weeks of initial claims below 300,000, the longest streak since 1970.
The following graph shows the 4-week moving average of weekly claims since 1971.
 Click on graph for larger image.
The dashed line on the graph is the current 4-week average. The four-week average of weekly unemployment claims decreased to 264,000.
This was lower than the consensus forecast of 265,000. The low level of claims suggests relatively few layoffs.
Wednesday, August 24, 2016
Thursday: Travel Day
by Calculated Risk on 8/24/2016 06:40:00 PM
As a reminder: NAR Existing Home Sales Report vs. Tom Lawler's LEHC Projection from Last Week
Existing Home Sales (SAAR): NAR, 5.39 million; LEHC, 5.41 million; “Consensus”, 5.52 million
Inventory of EHS for Sale: NAR, 2.13 million; LEHC, 2.14 million.
YOY % Change, Median Existing SF Home Sales Price: NAR, 5.4%; LEHC, 5.3%.
Note: Thursday is a travel day - no posting until later in the day.
Thursday:
At 8:30 AM ET, The initial weekly unemployment claims report will be released. The consensus is for 265 thousand initial claims, up from 262 thousand the previous week.
Also at 8:30 AM, Durable Goods Orders for June from the Census Bureau. The consensus is for a 3.7% increase in durable goods orders.
At 11:00 AM, Kansas City Fed Survey of Manufacturing Activity for August.
Existing Home Sales decline in July to 5.39 million SAAR
by Calculated Risk on 8/24/2016 10:06:00 AM
CR Note: I'm in NYC and I will post graphs when I return home.
From the NAR: Existing-Home Sales Lose Steam in July
Total existing-home sales, which are completed transactions that include single-family homes, townhomes, condominiums and co-ops, fell 3.2 percent to a seasonally adjusted annual rate of 5.39 million in July from 5.57 million in June. For only the second time in the last 21 months 2, sales are now below (1.6 percent) a year ago (5.48 million).Sales in July (5.39 million SAAR) were 3.2% lower than last month, and were 1.6% below the July 2015 rate.
Total housing inventory at the end of July inched 0.9 percent higher to 2.13 million existing homes available for sale, but is still 5.8 percent lower than a year ago (2.26 million) and has now declined year-over-year for 14 straight months. Unsold inventory is at a 4.7-month supply at the current sales pace, which is up from 4.5 months in June.
According to the NAR, inventory increased to 2.13 million in July from 2.11 million in June. Headline inventory is not seasonally adjusted, and inventory usually decreases to the seasonal lows in December and January, and peaks in mid-to-late summer.
Inventory decreased 5.8% year-over-year in July compared to July 2015.
Months of supply was at 4.7 months in July.
This was below consensus expectations (but not a surprise for CR readers). For existing home sales, a key number is inventory - and inventory is still low. I'll have more after I return home.


