by Calculated Risk on 5/04/2016 08:42:00 AM
Wednesday, May 04, 2016
Trade Deficit decreased in March to $40.4 Billion
The Department of Commerce reported:
The U.S. Census Bureau and the U.S. Bureau of Economic Analysis, through the Department of Commerce, announced today that the goods and services deficit was $40.4 billion in March, down $6.5 billion from $47.0 billion in February, revised. March exports were $176.6 billion, $1.5 billion less than February exports. March imports were $217.1 billion, $8.1 billion less than February imports.The trade deficit was smaller than the consensus forecast of $41.4 billion.
The first graph shows the monthly U.S. exports and imports in dollars through March 2016.
 Click on graph for larger image.
Both imports and exports decreased in March.
Exports are 6% above the pre-recession peak and down 5% compared to March 2015; imports are 6% below the pre-recession peak, and down 9% compared to March 2015.
The second graph shows the U.S. trade deficit, with and without petroleum.
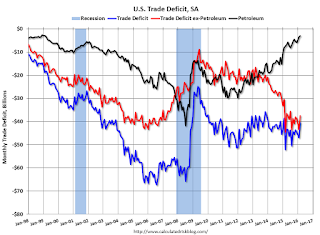 The blue line is the total deficit, and the black line is the petroleum deficit, and the red line is the trade deficit ex-petroleum products.
Oil imports averaged $27.68 in March, up from $27.48 in February, and down from $46.47 in March 2015. The petroleum deficit has generally been declining and is the major reason the overall deficit has declined a little since early 2012.
The trade deficit with China decreased to $20.9 billion in March, from $31.2 billion in March 2015 (there was a surge in imports last year in March -as ships were unloaded - following the West Coast port slowdown). The deficit with China is a substantial portion of the overall deficit.
ADP: Private Employment increased 156,000 in April
by Calculated Risk on 5/04/2016 08:19:00 AM
Private sector employment increased by 156,000 jobs from March to April according to the April ADP National Employment Report®. ... The report, which is derived from ADP’s actual payroll data, measures the change in total nonfarm private employment each month on a seasonally-adjusted basis.This was below the consensus forecast for 193,000 private sector jobs added in the ADP report.
...
Goods-producing employment dropped by 11,000 jobs in April, down from a downwardly revised 5,000 in March. The construction industry added 14,000 jobs, which was down from March’s 18,000. Meanwhile, manufacturing lost 13,000 jobs after being revised down to -3,000 the previous month.
Service-providing employment rose by 166,000 jobs in April, down from 189,000 in March.
...
Mark Zandi, chief economist of Moody’s Analytics, said, “The job market appears to have stumbled in April. Job growth noticeably slowed, with some weakness across most sectors. One month does not make a trend, but this bears close watching as the financial market turmoil earlier in the year may have done some damage to business hiring.”
The BLS report for April will be released Friday, and the consensus is for 200,000 non-farm payroll jobs added in April.
MBA: Mortgage "Refis Down, Purchases Flat in Latest MBA Weekly Survey"
by Calculated Risk on 5/04/2016 07:00:00 AM
From the MBA: Refis Down, Purchases Flat in Latest MBA Weekly Survey
Mortgage applications decreased 3.4 percent from one week earlier, according to data from the Mortgage Bankers Association’s (MBA) Weekly Mortgage Applications Survey for the week ending April 29, 2016.
...
The Refinance Index decreased 6 percent from the previous week. The seasonally adjusted Purchase Index decreased 0.1 percent from one week earlier. The unadjusted Purchase Index increased 1 percent compared with the previous week and was 13 percent higher than the same week one year ago.
...
The average contract interest rate for 30-year fixed-rate mortgages with conforming loan balances ($417,000 or less) increased to 3.85 percent from 3.83 percent, with points increasing to 0.35 from 0.32 (including the origination fee) for 80 percent loan-to-value ratio (LTV) loans.
emphasis added
 Click on graph for larger image.
The first graph shows the refinance index since 1990.
Refinance activity was higher in 2015 than in 2014, but it was still the third lowest year since 2000.
Refinance activity increased a little earlier this year when rates declined.
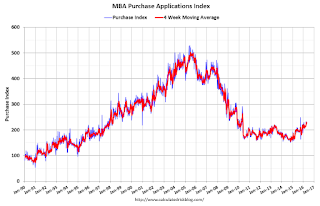 The second graph shows the MBA mortgage purchase index.
 According to the MBA, the unadjusted purchase index is 13% higher than a year ago.
Tuesday, May 03, 2016
Wednesday: Trade Deficit, ADP Employment, ISM non-Manufacturing
by Calculated Risk on 5/03/2016 07:34:00 PM
Wednesday:
• At 7:00 AM ET, the Mortgage Bankers Association (MBA) will release the results for the mortgage purchase applications index.
• At 8:15 AM, the ADP Employment Report for April. This report is for private payrolls only (no government). The consensus is for 193,000 payroll jobs added in April, down from 200,000 added in March.
• At 8:30 AM, the Trade Balance report for March from the Census Bureau. The consensus is for the U.S. trade deficit to be at $41.4 billion in March from $47.1 billion in February.
• At 10:00 AM, the ISM non-Manufacturing Index for April. The consensus is for index to increase to 54.7 from 54.5 in March.
• Also at 10:00 AM, Manufacturers' Shipments, Inventories and Orders (Factory Orders) for March. The consensus is a 0.6% increase in orders.
U.S. Light Vehicle Sales increase to 17.4 million annual rate in April
by Calculated Risk on 5/03/2016 03:40:00 PM
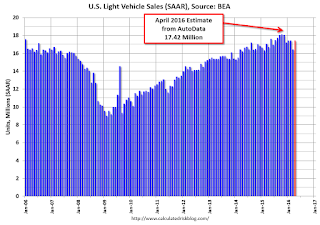
Based on an estimate from AutoData, light vehicle sales were at a 17.42 million SAAR in April.
That is up about 4% from April 2015, and up about 6% from the 16.46 million annual sales rate last month.
Click on graph for larger image.
This graph shows the historical light vehicle sales from the BEA (blue) and an estimate for April (red, light vehicle sales of 17.42 million SAAR from AutoData).
This was slightly above the consensus forecast of 17.3 million SAAR (seasonally adjusted annual rate).
The second graph shows light vehicle sales since the BEA started keeping data in 1967.

Sales for 2016 - through the first four months - are up about 3% from the comparable period last year.
The Projected Improvement in Life Expectancy
by Calculated Risk on 5/03/2016 12:07:00 PM
Note: This is an update to a post I wrote some time ago with more recent data and projections.
Here is something different, but it is important when looking at demographics ...
The following data is from the CDC United States Life Tables, 2010 by Elizabeth Arias.
The most frequently used life table statistic is life expectancy (ex), which is the average number of years of life remaining for persons who have attained a given age (x). ... Life expectancy at birth (e0) for 2010 for the total population was 78.7 years. ... Another way of assessing the longevity of the period life table cohort is by determining the proportion that survives to specified ages. ... To illustrate, 57,188 persons out of the original 2010 hypothetical life table cohort of 100,000 (or 57.2 %) were alive at exact age 80.Instead of look at life expectancy, here is a graph of survivors out of 100,000 born alive, by age for three groups: those born in 1900-1902, born in 1949-1951 (baby boomers), and born in 2010.
emphasis added
 Click on graph for larger image.
There was a dramatic change between those born in 1900 (blue) and those born mid-century (orange). The risk of infant and early childhood deaths dropped sharply, and the risk of death in the prime working years also declined significantly.
The CDC is projecting further improvement for childhood and prime working age for those born in 2010, but they are also projecting that people will live longer.
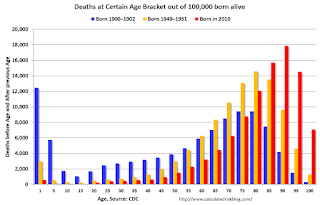 The second graph uses the same data but looks at the number of people who die before a certain age, but after the previous age. As an example, for those born in 1900 (blue), 12,448 of the 100,000 born alive died before age 1, and another 5,748 died between age 1 and age 5. That is 18.2% of those born in 1900 died before age 5.
In 1950, only 3.5% died before age 5. In 2010, it was 0.7%.
The peak age for deaths didn't change much for those born in 1900 and 1950 (between 76 and 80, but many more people born in 1950 will make it).
Now the CDC is projection the peak age for deaths - for those born in 2010 - will increase to 86 to 90!
Also the number of deaths for those younger than 20 will be very small (down to mostly accidents, guns, and drugs). Self-driving cars might reduce the accident components of young deaths.
In 1900, 25,2% died before age 20. And another 26.8% died before 55.
In 1950, 5.3% died before age 20. And another 18.7% died before 55. A dramatic decline in early deaths.
In 2010, 1.5% are projected to die before age 20. And only 9.7% before 55. A dramatic decline in prime working age deaths.
An amazing statistic: for those born in 1900, about 13 out of 100,000 made it to 100. For those born in 1950, 199 are projected to make to 100 - an significant increase. Now the CDC is projecting that 1,968 out of 100,000 born in 2010 will make it to 100. Stunning!
Some people look at this data and worry about supporting all the old people. To me, this is all great news - the vast majority of people can look forward to a long life - with fewer people dying in childhood or during their prime working years. Awesome!
CoreLogic: House Prices up 6.7% Year-over-year in March
by Calculated Risk on 5/03/2016 09:35:00 AM
Notes: This CoreLogic House Price Index report is for March. The recent Case-Shiller index release was for February. The CoreLogic HPI is a three month weighted average and is not seasonally adjusted (NSA).
From CoreLogic: CoreLogic US Home Price Report Shows Home Prices Up 6.7 Percent Year Over Year in March 2016
Home prices nationwide, including distressed sales, increased year over year by 6.7 percent in March 2016 compared with March 2015 and increased month over month by 2.1 percent in March 2016 compared with February 2016, according to the CoreLogic HPI.
...
“Home prices reached the bottom five years ago, and since then have appreciated almost 40 percent,” said Anand Nallathambi, president and CEO of CoreLogic. “The highest appreciation was in the West, where prices continue to increase at double-digit rates.”
emphasis added
 Click on graph for larger image.
 This graph shows the national CoreLogic HPI data since 1976. January 2000 = 100.
The index was up 2.1% in March (NSA), and is up 6.7% over the last year.
This index is not seasonally adjusted, and this was a solid month-to-month increase.
The index is still 5.3% below the bubble peak in nominal terms (not inflation adjusted).
 The second graph shows the YoY change in nominal terms (not adjusted for inflation).
The YoY increase had been moving sideways over the last year, but has picked up a little recently.
The year-over-year comparison has been positive for forty nine consecutive months.
Monday, May 02, 2016
Tuesday: Auto Sales
by Calculated Risk on 5/02/2016 07:52:00 PM
Tuesday:
• All day, Light vehicle sales for April. The consensus is for light vehicle sales to increase to 17.3 million SAAR in April from 16.6 million in March (Seasonally Adjusted Annual Rate).
A few excerpts from a research piece by Goldman Sachs economist Jan Hatzius: Does the Fed Want Inflation to Overshoot?
Many investors believe that the Fed has significantly changed its attitude to an inflation overshoot above 2%. The strong version of this view is that Janet Yellen is stealthily following the “optimal control” path she laid out in 2012 and is therefore targeting an overshoot. We think this is wrong. ...
The weaker version is that the target has become more unambiguously symmetric, and that many Fed officials would privately regard a limited overshoot as helping establish that symmetry in the public’s mind. This is probably correct. But the FOMC would still want to prevent the overshoot from getting too large, and would therefore tighten policy more quickly than in the baseline. ...
Fed Survey: Banks ease Standards on Residential Real Estate, Credit Quality in Oil Regions "deteriorated somewhat"
by Calculated Risk on 5/02/2016 02:15:00 PM
From the Federal Reserve: The April 2016 Senior Loan Officer Opinion Survey on Bank Lending Practices
Regarding loans to businesses, the April survey results indicated that, on balance, banks tightened their standards on commercial and industrial (C&I) and commercial real estate (CRE) loans over the first quarter of 2016.3 The survey results indicated that demand for C&I loans had weakened and that demand for CRE loans had strengthened during the first quarter on net.
The first of two sets of special questions asked banks about lending to firms in the oil and natural gas drilling or extraction sector. The majority of domestic banks reported that loans to firms in this sector account for less than 5 percent of their outstanding C&I loans. In contrast, the majority of foreign banks reported that loans to firms in this sector account for more than 5 percent of their outstanding C&I loans. On balance, both domestic and foreign banks expect delinquency and charge-off rates on such loans to deteriorate over 2016 and noted that they were undertaking several actions to mitigate the risk of loan losses. In addition, on balance, banks indicated that the credit quality of loans made to businesses and households located in regions of the United States that are dependent on the energy sector had deteriorated somewhat.
Regarding loans to households, banks reported having eased lending standards on most types of residential real estate (RRE) mortgage loans, while demand for these loans strengthened over the first quarter. Modest net fractions of banks reported easing lending standards on credit cards and other consumer loans, whereas lending standards for auto loans remained basically unchanged. Over the first quarter, banks reported stronger demand across all consumer loan categories.
emphasis added
Construction Spending increased 0.3% in March
by Calculated Risk on 5/02/2016 12:31:00 PM
Earlier today, the Census Bureau reported that overall construction spending increased 0.3% in March compared to February:
The U.S. Census Bureau of the Department of Commerce announced today that construction spending during March 2016 was estimated at a seasonally adjusted annual rate of $1,137.5 billion, 0.3 percent above the revised February estimate of $1,133.6 billion. The March figure is 8.0 percent above the March 2015 estimate of $1,052.9 billion.Private spending increased and public spending decreased in March:
Spending on private construction was at a seasonally adjusted annual rate of $842.3 billion, 1.1 percent above the revised February estimate of $832.8 billion. ...
In March, the estimated seasonally adjusted annual rate of public construction spending was $295.2 billion, 1.9 percent below the revised February estimate of $300.8 billion.
emphasis added
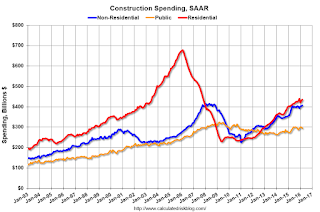 Click on graph for larger image.
This graph shows private residential and nonresidential construction spending, and public spending, since 1993. Note: nominal dollars, not inflation adjusted.
Private residential spending has been increasing, but is 36% below the bubble peak.
Non-residential spending is only 2% below the peak in January 2008 (nominal dollars).
Public construction spending is now 9% below the peak in March 2009.
 The second graph shows the year-over-year change in construction spending.
On a year-over-year basis, private residential construction spending is up 8%. Non-residential spending is up 9% year-over-year. Public spending is up 7% year-over-year.
Looking forward, all categories of construction spending should increase in 2016. Residential spending is still very low, non-residential is increasing (except oil and gas), and public spending is also increasing after several years of austerity.
This was below the consensus forecast of a 0.5% increase for March, and construction spending for February and January were revised down.

