 RSS Feed
 by Calculated Risk on 11/23/2015 01:02:00 PM
Monday, November 23, 2015
A Few Random Comments on October Existing Home Sales
Earlier: Existing Home Sales in October: 5.36 million SAAR
I expected some increase in inventory this year, but that hasn't happened. Inventory is still very low and falling year-over-year (down 4.5% year-over-year in September). More inventory would probably mean smaller price increases and slightly higher sales, and less inventory means lower sales and somewhat larger price increases.
It would seem if we do see lower sales - and higher prices - that should eventually lead to more inventory. So far the opposite has been true.
Also, if sales do slow, it is important to remember that new home sales are more important for jobs and the economy than existing home sales. Since existing sales are existing stock, the only direct contribution to GDP is the broker's commission. There is usually some additional spending with an existing home purchase - new furniture, etc - but overall the economic impact is small compared to a new home sale. So some slowing for existing home sales (if it happens) will not be a big deal for the economy.
Also, the NAR reported distressed sales declined further year-over-year and are now at the lowest level since the NAR started tracking distressed sales in 2008:
Distressed sales – foreclosures and short sales – declined to 6 percent in October, which is the lowest since NAR began tracking in October 2008; they were 9 percent a year ago. Five percent of October sales were foreclosures and 1 percent were short sales.The following graph shows existing home sales Not Seasonally Adjusted (NSA).
 Click on graph for larger image.
Sales NSA in October (red column) were the highest for October since 2006 (NSA).
Existing Home Sales in October: 5.36 million SAAR
by Calculated Risk on 11/23/2015 10:11:00 AM
From the NAR: Existing-Home Sales Dial Back in October
Total existing-home sales, which are completed transactions that include single-family homes, townhomes, condominiums and co-ops, fell 3.4 percent to a seasonally adjusted annual rate of 5.36 million in October from 5.55 million in September. Despite last month's decline, sales are still 3.9 percent above a year ago (5.16 million). ...
Total housing inventory at the end of October decreased 2.3 percent to 2.14 million existing homes available for sale, and is now 4.5 percent lower than a year ago (2.24 million). Unsold inventory is at a 4.8-month supply at the current sales pace, up from 4.7 months in September.
 Click on graph for larger image.
This graph shows existing home sales, on a Seasonally Adjusted Annual Rate (SAAR) basis since 1993.
Sales in October (5.36 million SAAR) were 3.4% lower than last month, and were 3.9% above the October 2014 rate.
The second graph shows nationwide inventory for existing homes.
 According to the NAR, inventory decreased to 2.14 million in October from 2.19 million in September. Headline inventory is not seasonally adjusted, and inventory usually decreases to the seasonal lows in December and January, and peaks in mid-to-late summer.
The third graph shows the year-over-year (YoY) change in reported existing home inventory and months-of-supply. Since inventory is not seasonally adjusted, it really helps to look at the YoY change. Note: Months-of-supply is based on the seasonally adjusted sales and not seasonally adjusted inventory.
 Inventory decreased 4.5% year-over-year in October compared to October 2014.
 Months of supply was at 4.8 months in October.
This was below expectations of sales of 5.41 million. For existing home sales, a key number is inventory - and inventory is still low. I'll have more later ...
Chicago Fed: "Index shows economic growth improved in October"
by Calculated Risk on 11/23/2015 08:46:00 AM
The Chicago Fed released the national activity index (a composite index of other indicators): Index shows economic growth improved in October
Led by improvements in employment- and production-related indicators, the Chicago Fed National Activity Index (CFNAI) rose to –0.04 in October from –0.29 in September. Two of the four broad categories of indicators that make up the index increased from September, but only one category made a positive contribution to the index in October.This graph shows the Chicago Fed National Activity Index (three month moving average) since 1967.
The index’s three-month moving average, CFNAI-MA3, decreased to –0.20 in October from –0.03 in September. October’s CFNAI-MA3 suggests that growth in national economic activity was somewhat below its historical trend. The economic growth reflected in this level of the CFNAI-MA3 suggests subdued inflationary pressure from economic activity over the coming year.
emphasis added
 Click on graph for larger image.
This suggests economic activity was a little below the historical trend in October (using the three-month average).
According to the Chicago Fed:
What is the National Activity Index? The index is a weighted average of 85 indicators of national economic activity drawn from four broad categories of data: 1) production and income; 2) employment, unemployment, and hours; 3) personal consumption and housing; and 4) sales, orders, and inventories.
A zero value for the index indicates that the national economy is expanding at its historical trend rate of growth; negative values indicate below-average growth; and positive values indicate above-average growth.
Sunday, November 22, 2015
Monday: Existing Home Sales
by Calculated Risk on 11/22/2015 07:45:00 PM
An excerpt from a Tim Duy piece at Fed Watch: Mission Accomplished
Bottom Line: The Fed is set to declare “Mission Accomplished” at the next FOMC meeting. Indeed, many policymakers have already said as much. Absent a very significant change in the outlook, failure to hike rates in December would renew the barrage of criticism regarding their communications strategy that prompted them to highlight the December meeting in their last statement. Once they have communicated their intentions for subsequent rate hikes, they will turn their attention to the issue of normalizing the balance sheet. Even though officials have not committed to a specific path, I am working with a baseline of 100bp of tightening between now and next December, or roughly 25bp every other meeting. I expect that by the second quarter of next year they will begin communicating the fate of the balance sheet. Whether they should hike or not remains a separate issue. Over the next twelve months we will learn the extent of which the Federal Reserve can resist the global downward pull of interest rates. Other central banks have been less-than-successful in their efforts to pull off of the zero bound – not exactly a hopeful precedent.Monday:
• At 8:30 AM ET, the Chicago Fed National Activity Index for October. This is a composite index of other data.
• At 10:00 AM, Existing Home Sales for October from the National Association of Realtors (NAR). The consensus is for 5.41 million SAAR, down from 5.55 million in September. Economist Tom Lawler estimates the NAR will report sales of 5.33 million SAAR.
Weekend:
• Schedule for Week of November 22, 2015
From CNBC: Pre-Market Data and Bloomberg futures: currently S&P futures are up 5 and DOW futures are up 40 (fair value).
Oil prices were up over the last week with WTI futures at $41.59 per barrel and Brent at $44.50 per barrel. A year ago, WTI was at $75, and Brent was at $77 - so prices are down about 40% year-over-year (It was a year ago that prices were falling sharply).
Here is a graph from Gasbuddy.com for nationwide gasoline prices. Nationally prices are at $2.08 per gallon (down about $0.75 per gallon from a year ago).
Analysts: Q3 GDP to be Revised Up
by Calculated Risk on 11/22/2015 11:55:00 AM
Note: The second estimate of Q3 GDP will be released on Tuesday. The consensus is that real GDP increased 2.1% annualized in Q3, revised up from the advance estimate of 1.5%. Note that domestic demand was solid in Q3, and that the weakness was mostly due to changes in inventory.
Merrill Lynch on GDP revision:
In the second release of 3Q GDP, we expect growth to be revised up to 2.1% qoq saar from the preliminary estimate of 1.5%. Inventories will be the primary driver, as stronger-than-anticipated September data revealed less inventory drawdown than initially assumed. Instead of a 1.4pp drag on 3Q growth, inventories will likely have a negative contribution closer to 0.8pp. Elsewhere, consumer spending and residential investment will likely be revised up, while structures investment should head lower. Advance trade data released at the same time as GDP may contain revisions to 3Q, so there is some uncertainty in our forecast.And from Nomura:
We expect the GDP price index to be unrevised at 1.2% qoq, with the core PCE price index similarly unrevised at 1.3%.
We expect Q3 GDP to be revised up by 0.9pp in its second estimate to 2.4% from 1.5%. We expect the upward revision to be primarily due to stronger-than-assumed inventory investment. Domestic demand in the aggregate should remain roughly unchanged, as upward revisions to government spending and residential fixed investment were likely countered by weaker-than-expected business investment. We expect final sales growth to remain at 3.0% and forecast that inventory investment will subtract 0.6pp from growth compared with the assumed 1.4pp previously.
Saturday, November 21, 2015
Schedule for Week of November 22nd
by Calculated Risk on 11/21/2015 08:11:00 AM
This will be a short, but busy holiday week.
The key reports this week are the second estimate of Q3 GDP, October New Home sales, October Existing Home Sales, October personal income and outlays, and September Case-Shiller house prices.
8:30 AM ET: Chicago Fed National Activity Index for October. This is a composite index of other data.
 10:00 AM: Existing Home Sales for October from the National Association of Realtors (NAR). The consensus is for 5.41 million SAAR, down from 5.55 million in September.
 Economist Tom Lawler estimates the NAR will report sales of 5.33 million SAAR.
A key will be the reported year-over-year change in inventory of homes for sale.
8:30 AM ET: Gross Domestic Product, 3rd quarter 2015 (Second estimate). The consensus is that real GDP increased 2.1% annualized in Q3, revised up from the advance estimate of 1.5%.
 9:00 AM: S&P/Case-Shiller House Price Index for September. Although this is the September report, it is really a 3 month average of July, August and September prices.
This graph shows the nominal seasonally adjusted National Index, Composite 10 and Composite 20 indexes through the August 2015 report (the Composite 20 was started in January 2000).
The consensus is for a 5.3% year-over-year increase in the Comp 20 index for September. The Zillow forecast is for the National Index to increase 4.7% year-over-year in September.
10:00 AM: Richmond Fed Survey of Manufacturing Activity for November.
7:00 AM ET: The Mortgage Bankers Association (MBA) will release the results for the mortgage purchase applications index.
8:30 AM: The initial weekly unemployment claims report will be released. The consensus is for 270 thousand initial claims, down from 271 thousand the previous week.
8:30 AM: Durable Goods Orders for October from the Census Bureau. The consensus is for a 1.5% decrease in durable goods orders.
8:30 AM ET: Personal Income and Outlays for October. The consensus is for a 0.4% increase in personal income, and for a 0.3% increase in personal spending. And for the Core PCE price index to increase 0.2%.
9:00 AM: FHFA House Price Index for September 2015. This was originally a GSE only repeat sales, however there is also an expanded index. The consensus is for a 0.4% month-to-month increase for this index.
 10:00 AM: New Home Sales for October from the Census Bureau.
 This graph shows New Home Sales since 1963. The dashed line is the August sales rate.
The consensus is for a increase in sales to 499 thousand Seasonally Adjusted Annual Rate (SAAR) in October from 468 thousand in September.
10:00 AM: University of Michigan's Consumer sentiment index (final for November). The consensus is for a reading of 93.1, unchanged from the preliminary reading.
All US markets will be closed in observance of the Thanksgiving Day Holiday.
The NYSE and the NASDAQ will close at 1:00 PM ET.
Friday, November 20, 2015
Goldman Sachs: Expect FOMC to Raise Fed Funds Rate 100bp in 2016
by Calculated Risk on 11/20/2015 08:37:00 PM
A few excerpts from a research piece by Goldman Sachs economists Zach Pandl and Jan Hatzius:
The US economy in 2016 is likely to be driven once again by domestic demand—particularly consumer spending. We forecast that GDP will increase by 2.25% Q4/Q4 next year, in line with our latest estimates for 2015. ... Both narrow and broad measures of unemployment have fallen significantly ...
The Federal Reserve looks likely to begin raising short-term interest rates next month, seven years after cutting them to zero. ... Based on our economic forecasts, we currently expect the committee to raise the funds rate by 100bp next year, or one hike per quarter—a fair amount above the 55-60bp pace priced into the bond market. Admittedly, we see the risks to this forecasts as skewed to the downside at the moment. The pace of rate hikes will depend on progress toward the FOMC’s employment and inflation goals, as well as evolving views on the level of equilibrium interest rates.
NY Fed: Household Debt increased $212 billion Q3 2015
by Calculated Risk on 11/20/2015 02:03:00 PM
The Q3 report was released yesterday: Household Debt and Credit Report.
From the NY Fed: Just Released: New and Improved Charts and Data on Auto Loans
Today, the New York Fed announced that household debt increased by a robust $212 billion in the third quarter of 2015. Both mortgage and auto loan originations increased, as auto originations reached a ten-year high and new mortgage lending appears to have finally recovered from the very low levels seen in the past year. This quarter, we’re introducing an improved estimate of auto loan originations, some new charts, and some fresh data on the auto loan market. The Quarterly Report on Household Debt and Credit and this analysis use our Consumer Credit Panel data, which is itself based on Equifax credit data.
...
The continued growth in auto lending, subprime lending in particular, is a topic that we’ve monitored closely over the past few years, and we’re just now seeing some increase in delinquency rates on loans made by auto finance companies. Because there are a large number of subprime borrowers in this sector, these borrowers may be more sensitive to developments in the labor market, and the increases in the outstanding balances of these borrowers may pose some risks. That said, any comparison with the subprime mortgage market of the 2000s that led to the crisis should note that the volume of subprime mortgages outstanding in 2007 was nearly four times the volume of subprime auto loans outstanding today ($250 billion).
emphasis added
 Click on graph for larger image.
Here are two graphs from the report:
The first graph shows aggregate consumer debt increased in Q3. Household debt peaked in 2008, and bottomed in Q2 2013.
Even mortgage debt is increasing now, from the NY Fed:
Mortgage balances, the largest component of household debt, increased in the third quarter. Mortgage balances shown on consumer credit reports stood at $8.26 trillion, a $144 billion increase from the second quarter of 2015.
 The second graph shows the percent of debt in delinquency. The percent of delinquent debt is declining, although there is still a large percent of debt 90+ days delinquent (Yellow, orange and red).
 The overall delinquency rate decreased slightly in Q3 to 5.6%. From the NY Fed:
Overall delinquency rates improved modestly in 2015Q3. As of September 30, 5.6% of outstanding debt was in some stage of delinquency. Of the $672 billion of debt that is delinquent, $455 billion is seriously delinquent (at least 90 days late or “severely derogatory”).There are a number of credit graphs at the NY Fed site.
Kansas City Fed: Regional Manufacturing Activity expanded slightly in October, First Time since February
by Calculated Risk on 11/20/2015 11:00:00 AM
From the Kansas City Fed: Tenth District Manufacturing Activity was Largely Flat
The Federal Reserve Bank of Kansas City released the November Manufacturing Survey today. According to Chad Wilkerson, vice president and economist at the Federal Reserve Bank of Kansas City, the survey revealed that growth in Tenth District manufacturing activity was largely flat, although expectations for future activity improved considerably.The declines for most of this year in manufacturing activity, in the Kansas City region, was probably mostly due to lower oil prices and weaker exports due to the strong dollar.
“We saw our composite index move just slightly into positive territory for the first time since February, as some segments of durable manufacturing improved even as activity in our energy states remained sluggish,” said Wilkerson.
...
Tenth District manufacturing activity was largely flat in November, although expectations for future activity improved considerably from the previous few months. Most price indexes edged back down after rising slightly last month.
The month-over-month composite index was 1 in November, up from -1 in October and -8 in September
...
Most future factory indexes continued to rise after falling markedly a few months ago. The future composite index jumped from -1 to 8, and the future production, shipments, and new orders indexes also increased. The future employment index rose from 6 to 13, its highest level in nine months.
emphasis added
BLS on State Unemployment Rates: No State at or above 7%, First Time since early 2007
by Calculated Risk on 11/20/2015 10:12:00 AM
From the BLS: Regional and State Employment and Unemployment Summary
Regional and state unemployment rates were little changed in October. Thirty-two states and the District of Columbia had unemployment rate decreases from September, 3 states had increases, and 15 states had no change, the U.S. Bureau of Labor Statistics reported today.
...
North Dakota had the lowest jobless rate in October, 2.8 percent, followed by Nebraska, 2.9 percent. West Virginia had the highest rate, 6.9 percent.
 Click on graph for larger image.
This graph shows the current unemployment rate for each state (red), and the max during the recession (blue). All states are well below the maximum unemployment rate for the recession.
The size of the blue bar indicates the amount of improvement. The yellow squares are the lowest unemployment rate per state since 1976.
The states are ranked by the highest current unemployment rate. West Virginia, at 6.9%, had the highest state unemployment rate.
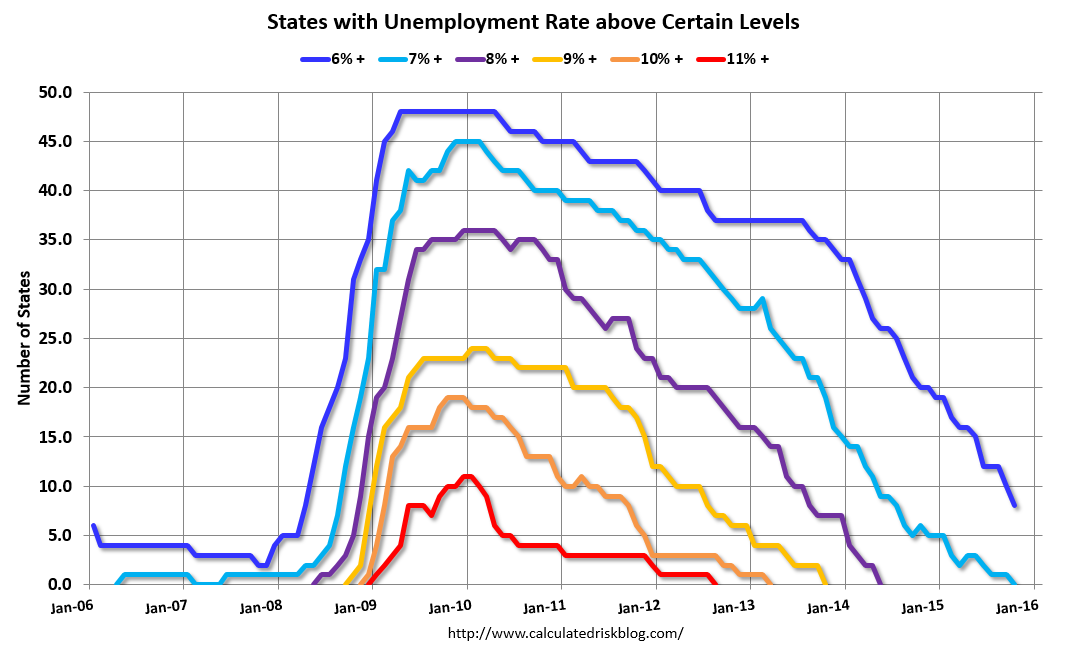 The second graph shows the number of states (and D.C.) with unemployment rates at or above certain levels since January 2006. At the worst of the employment recession, there were 11 states with an unemployment rate at or above 11% (red).
Currently no state has an unemployment rate at or above 7% (light blue); Only eight states are at or above 6% (dark blue).


