by Calculated Risk on 9/02/2015 07:07:00 PM
Wednesday, September 02, 2015
Thursday: Trade Deficit, Unemployment Claims, ISM non-mfg
From Matthew Graham at Mortgage News Daily: Mortgage Rates Still Waiting for Bigger News
Mortgage rates were almost flat again today. Most lenders were just a hair higher in costs vs yesterday. The most prevalent conventional 30yr fixed quote remains 4.0% for top tier scenarios, but 3.875% is still available.Mortgage rates are mostly moving sideways.
Thursday:
• At 8:30 AM ET, the initial weekly unemployment claims report will be released. The consensus is for 273 thousand initial claims, up from 271 thousand the previous week.
• Also at 8:30 AM, Trade Balance report for July from the Census Bureau. The consensus is for the U.S. trade deficit to be at $42.9 billion in July from $42.8 billion in June.
• At 10:00 AM, the ISM non-Manufacturing Index for August. The consensus is for index to decrease to 58.5 from 60.3 in July.
Fed's Beige Book: Economic Activity Expanded
by Calculated Risk on 9/02/2015 02:04:00 PM
Fed's Beige Book "Prepared at the Federal Reserve Bank of Boston based on information collected on or before August 24, 2015."
Reports from the twelve Federal Reserve Districts indicate economic activity continued expanding across most regions and sectors during the reporting period from July to mid-August. Six Districts cited moderate growth while New York, Philadelphia, Atlanta, Kansas City, and Dallas reported modest increases in activity. The Cleveland District noted only slight growth since the last report. In most cases, these recent results represented a continuation of the overall pace reported in the July Beige Book. Respondents in most sectors across Districts expected growth to continue at its recent pace, but the Kansas City report cited more mixed expectations.And on real estate:
District reports on manufacturing activity were mostly positive, although among these, the Cleveland, St. Louis, Minneapolis, and Dallas Districts painted a somewhat mixed picture across manufacturing sectors. Only the New York and Kansas City Districts cited declines in manufacturing.
Residential real estate activity improved across the 12 Districts, with home sales and home prices increasing in every District, while construction activity was more mixed. ...Mostly positive.
District reports on commercial real estate were positive on balance. Commercial leasing activity increased in the Richmond, Atlanta, Chicago, St. Louis, Minneapolis, and Kansas City Districts. Leasing activity was steady in the Philadelphia District, steady or increasing in the New York District, and mixed in the Boston District. Leasing demand was described as very strong in large cities, including Boston, New York, Philadelphia, Chicago, and Dallas, but Houston saw weak leasing demand.
emphasis added
FDIC: Fewer Problem banks, Residential REO Declines in Q2
by Calculated Risk on 9/02/2015 11:15:00 AM
The FDIC released the Quarterly Banking Profile for Q2 today:
Commercial banks and savings institutions insured by the Federal Deposit Insurance Corporation (FDIC) reported aggregate net income of $43.0 billion in the second quarter of 2015, up $2.9 billion (7.3 percent) from a year earlier and the highest quarterly income on record. The increase in earnings was mainly attributable to a $3.6 billion rise in net operating revenue (net interest income plus total noninterest income). Financial results for the second quarter of 2015 are included in the FDIC's latest Quarterly Banking Profile released today.
...
"Bankers generally reported another quarter of higher earnings, improved asset quality, and increased lending," [FDIC Chairman Martin] Gruenberg said. "There were fewer problem banks, and only one bank failed during the second quarter.
"However," he continued, "the low interest-rate environment remains a challenge. Many institutions have responded by acquiring higher-yielding, longer-term assets, but this has left banks more vulnerable to rising interest rates and that is a matter of ongoing supervisory attention."
...
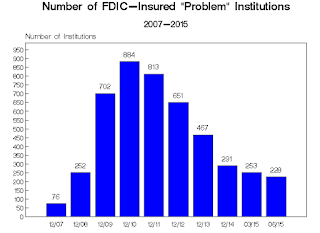
"Problem List" Continues to Shrink: The number of banks on the FDIC's Problem List fell from 253 to 228 during the second quarter. This is the smallest number of problem banks in nearly seven years and is down dramatically from the peak of 888 in the first quarter of 2011. Total assets of problem banks fell from $60.3 billion to $56.5 billion during the second quarter.
Deposit Insurance Fund (DIF) Rises $2.3 Billion to $67.6 Billion: The DIF increased from $65.3 billion in the first quarter to $67.6 billion in the second quarter, largely driven by $2.3 billion in assessment income. The DIF reserve ratio rose from 1.03 percent to 1.06 percent during the quarter.
 Click on graph for larger image.
The FDIC reported the number of problem banks declined (Note: graph shows problem banks for Q1 and Q2 2015, and year end prior to 2015):
The number of insured commercial banks and savings institutions reporting quarterly financial results in the second quarter fell to 6,348 from 6,419 reporters in the first quarter. During the quarter, 66 institutions were merged into other banks, while one insured institution failed. This is the first time since fourth quarter 2007 that there has been only one failure in a quarter. For a sixth consecutive quarter, no new charters were added. Banks reported 2,042,386 full-time equivalent employees in the second quarter, down from 2,042,688 in the first quarter and 2,059,827 in second quarter 2014. The number of insured institutions on the FDIC’s “Problem List” declined for a 17th consecutive quarter, from 253 to 228. Total assets of problem institutions fell from $60.3 billion to $56.5 billion.
 The dollar value of 1-4 family residential Real Estate Owned (REOs, foreclosure houses) declined from $5.72 billion in Q1 2015 to $5.23 billion in Q2. This is the lowest level of REOs since Q2 2007.
This graph shows the nominal dollar value of Residential REO for FDIC insured institutions. Note: The FDIC reports the dollar value and not the total number of REOs.
ADP: Private Employment increased 190,000 in August
by Calculated Risk on 9/02/2015 08:20:00 AM
Private sector employment increased by 190,000 jobs from July to August according to the August ADP National Employment Report®. ... The report, which is derived from ADP’s actual payroll data, measures the change in total nonfarm private employment each month on a seasonally-adjusted basis.This was below the consensus forecast for 210,000 private sector jobs added in the ADP report.
...
Goods-producing employment rose by 17,000 jobs in August, more than double the 7,000 gained in July. The construction industry added 17,000 jobs in August, up from 15,000 last month. Meanwhile, manufacturing added 7,000 jobs in August, after gaining only 1,000 in July.
Service-providing employment rose by 173,000 jobs in August, up slightly from 170,000 in July. ...
Mark Zandi, chief economist of Moody’s Analytics, said, “Recent global financial market turmoil has not slowed the U.S. job market, at least not yet. Job growth remains strong and broad-based, except in the energy industry, which continues to shed jobs. Large companies also remain more cautious in their hiring than smaller ones.”
The BLS report for August will be released Friday, and the consensus is for 223,000 non-farm payroll jobs added in August.
MBA: Mortgage Applications Increase in Latest Weekly Survey, Purchase Index up 25% YoY
by Calculated Risk on 9/02/2015 07:00:00 AM
From the MBA: Mortgage Applications Increase in Latest MBA Weekly Survey
Mortgage applications increased 11.3 percent from one week earlier, according to data from the Mortgage Bankers Association’s (MBA) Weekly Mortgage Applications Survey for the week ending August 28, 2015. ...
The Refinance Index increased 17 percent from the previous week to its highest level since April 2015. The seasonally adjusted Purchase Index increased 4 percent from one week earlier to its highest level since July 2015. The unadjusted Purchase Index increased 2 percent compared with the previous week and was 25 percent higher than the same week one year ago.
...
“Although mortgage rates were unchanged for the week, Treasury rates were down sharply early in the week due to the global stock market rout and this led to a significant increase in application volume,” said Mike Fratantoni, MBA’s Chief Economist.
...
The average contract interest rate for 30-year fixed-rate mortgages with conforming loan balances ($417,000 or less) remained unchanged at 4.08 percent, with points increasing to 0.37 from 0.36 (including the origination fee) for 80 percent loan-to-value ratio (LTV) loans.
emphasis added
 Click on graph for larger image.
The first graph shows the refinance index.
Refinance activity remains low.
2014 was the lowest year for refinance activity since year 2000, and refinance activity will probably stay low for the rest of 2015 (after the increase earlier this year).
 The second graph shows the MBA mortgage purchase index.
 According to the MBA, the unadjusted purchase index is 25% higher than a year ago.
Tuesday, September 01, 2015
Wednesday: ADP Employment, Beige Book
by Calculated Risk on 9/01/2015 08:03:00 PM
Auto sales and construction spending were solid, although manufacturing was weak. However the weakness in manufacturing is mostly due to lower oil prices and the strong dollar, so overall the US data has been fairly solid.
Wednesday:
• At 7:00 AM ET, the Mortgage Bankers Association (MBA) will release the results for the mortgage purchase applications index.
• At 8:15 AM, the ADP Employment Report for August. This report is for private payrolls only (no government). The consensus is for 210,000 payroll jobs added in August, up from 185,000 in July.
• At 10:00 AM, Manufacturers' Shipments, Inventories and Orders (Factory Orders) for July. The consensus is a 0.9% increase in orders.
• At 2:00 PM, the Federal Reserve Beige Book, an informal review by the Federal Reserve Banks of current economic conditions in their Districts.
U.S. Light Vehicle Sales increased to 17.7 million annual rate in August
by Calculated Risk on 9/01/2015 02:31:00 PM
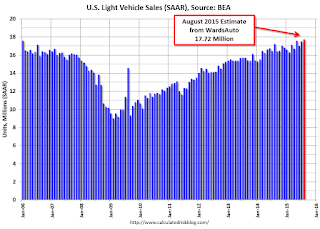
Based on a WardsAuto estimate, light vehicle sales were at a 17.72 million SAAR in August. That is up 2.9% from August 2014, and up 1.3% from the 17.5 million annual sales rate last month.
Click on graph for larger image.
This graph shows the historical light vehicle sales from the BEA (blue) and an estimate for July (red, light vehicle sales of 17.7 million SAAR from WardsAuto).
This was above to the consensus forecast of 17.3 million SAAR (seasonally adjusted annual rate).
The second graph shows light vehicle sales since the BEA started keeping data in 1967.

This was another very strong month for auto sales - even with Labor Day falling in the September sales month this year (it was included in August last year).
It appears 2015 will be the best year for light vehicle sales since 2001.
CoreLogic: House Prices up 6.9% Year-over-year in July
by Calculated Risk on 9/01/2015 12:25:00 PM
Notes: This CoreLogic House Price Index report is for July. The recent Case-Shiller index release was for June. The CoreLogic HPI is a three month weighted average and is not seasonally adjusted (NSA).
From CoreLogic: CoreLogic Reports Home Prices Rose by 6.9 Percent Year Over Year in July
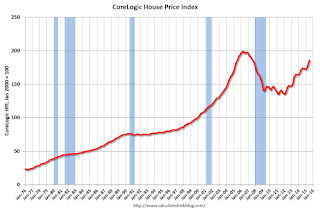
Home prices, including distressed sales, increased 6.9 percent in July 2015 compared to July 2014. June marks the 41st consecutive month of year-over-year home price gains.
Excluding distressed sales, home prices increased by 6.7 percent year over year in July.
On a month-over-month basis, home prices increased by 1.7 percent in July compared to June data. Excluding distressed sales, home prices were up 1.5 percent month over month in July 2015.
Home prices nationwide remain 6.6 percent below their peak, which was set in April 2006.
emphasis added
 Click on graph for larger image.
 This graph shows the national CoreLogic HPI data since 1976. January 2000 = 100.
The index was up 1.7% in July (NSA), and is up 6.9% over the last year.
This index is not seasonally adjusted, and this was a solid month-to-month increase.
 The second graph is from CoreLogic. The year-over-year comparison has been positive for forty one consecutive months.
The YoY increase had been moving sideways over most of the last year, but has picked up recently.
Construction Spending increased 0.7% in July
by Calculated Risk on 9/01/2015 11:03:00 AM
The Census Bureau reported that overall construction spending increased in July:
The U.S. Census Bureau of the Department of Commerce announced today that construction spending during July 2015 was estimated at a seasonally adjusted annual rate of $1,083.4 billion, 0.7 percent above the revised June estimate of $1,075.9 billion. The July figure is 13.7 percent above the July 2014 estimate of $952.5 billionPrivate spending increased and public spending decreased:
Spending on private construction was at a seasonally adjusted annual rate of $787.8 billion, 1.3 percent above the revised June estimate of $777.4 billion. ...Note: Non-residential for offices and hotels is generally increasing, but spending for oil and gas has been declining. Early in the recovery, there was a surge in non-residential spending for oil and gas (because oil prices increased), but now, with falling prices, oil and gas is a drag on overall construction spending.
In July, the estimated seasonally adjusted annual rate of public construction spending was $295.6 billion, 1.0 percent below the revised June estimate of $298.5 billion.
emphasis added
As an example, construction spending for private lodging is up 41% year-over-year, whereas spending for power (includes oil and gas) construction peaked in mid-2014 and is down 13% year-over-year.
 Click on graph for larger image.
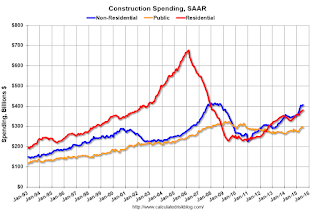
This graph shows private residential and nonresidential construction spending, and public spending, since 1993. Note: nominal dollars, not inflation adjusted.
Private residential spending has been increasing recently, and is 44% below the bubble peak.
Non-residential spending is only 2% below the peak in January 2008 (nominal dollars).
Public construction spending is now 9% below the peak in March 2009 and about 12% above the post-recession low.
 The second graph shows the year-over-year change in construction spending.
On a year-over-year basis, private residential construction spending is up 16%. Non-residential spending is up 18% year-over-year. Public spending is up 6% year-over-year.
Looking forward, all categories of construction spending should increase in 2015. Residential spending is still very low, non-residential is increasing (except oil and gas), and public spending has also increasing after several years of austerity.
This was close to the consensus forecast of a 0.8% increase, and spending for May and June was revised up. Overall, another solid construction report.
ISM Manufacturing index decreased to 51.1 in August
by Calculated Risk on 9/01/2015 10:03:00 AM
The ISM manufacturing index suggested expansion in August. The PMI was at 51.1% in August, down from 52.7% in July. The employment index was at 51.2%, down from 52.7% in July, and the new orders index was at 51.6%, down from 56.5%.
From the Institute for Supply Management: August 2015 Manufacturing ISM® Report On Business®
Economic activity in the manufacturing sector expanded in August for the 32nd consecutive month, and the overall economy grew for the 75th consecutive month, say the nation’s supply executives in the latest Manufacturing ISM® Report On Business®.
The report was issued today by Bradley J. Holcomb, CPSM, CPSD, chair of the Institute for Supply Management® (ISM®) Manufacturing Business Survey Committee. "The August PMI® registered 51.1 percent, a decrease of 1.6 percentage points from the July reading of 52.7 percent. The New Orders Index registered 51.7 percent, a decrease of 4.8 percentage points from the reading of 56.5 percent in July. The Production Index registered 53.6 percent, 2.4 percentage points below the July reading of 56 percent. The Employment Index registered 51.2 percent, 1.5 percentage points below the July reading of 52.7 percent. Inventories of raw materials registered 48.5 percent, a decrease of 1 percentage point from the July reading of 49.5 percent. The Prices Index registered 39 percent, down 5 percentage points from the July reading of 44 percent, indicating lower raw materials prices for the 10th consecutive month. The New Export Orders Index registered 46.5 percent, down 1.5 percentage points from the July reading of 48 percent. Comments from the panel reflect a mix of modest to strong growth depending upon the specific industry, the positive impact of lower raw materials prices, but also a continuing concern over export growth."
emphasis added
 Click on graph for larger image.
Here is a long term graph of the ISM manufacturing index.
This was below expectations of 52.8%, and indicates slower manufacturing expansion in August.


