by Calculated Risk on 7/26/2015 10:25:00 AM
Sunday, July 26, 2015
WSJ: More Oil Industry Layoffs Coming
From Lynn Cook at the WSJ: Sudden Drop in Crude-Oil Prices Roils U.S. Energy Firms’ Rebound
U.S. energy companies are planning more layoffs, asset sales and financial maneuvers to deal with a recent, sudden drop in U.S. crude-oil prices to under $50 a barrel, the lowest level in four months.
...
Nearly 50,000 energy jobs have been lost in the past three months on top of 100,000 employees laid off since oil prices started to tumble last fall, according to Graves & Co., a Houston energy consultancy.
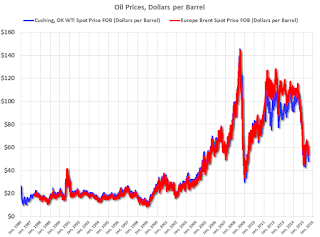 Click on graph for larger image
This graph shows WTI and Brent spot oil prices from the EIA. (Prices Friday added). According to Bloomberg, WTI was at $48.14 per barrel on Friday, and Brent at $54.62.
Prices are down about 50% year-over-year.
The second graph shows the prices over the last few years.
 Some producers stopped cutting when prices started to rebound, but now prices are declining again - and there will probably be more layoffs in the oil sector.
 Note: Several oil producing states are already in recession such as North Dakota, Oklahoma and Alaska, but overall lower oil prices will be a positive for the U.S. economy.
Saturday, July 25, 2015
Schedule for Week of July 26, 2015
by Calculated Risk on 7/25/2015 08:15:00 AM
The key reports this week are Q2 GDP on Thursday, and Case-Shiller house prices on Tuesday.
The FOMC meets on Tuesday and Wednesday, and no change to policy is expected at this meeting.
8:30 AM: Durable Goods Orders for June from the Census Bureau. The consensus is for a 3.1% increase in durable goods orders.
10:30 AM: Dallas Fed Manufacturing Survey for July.
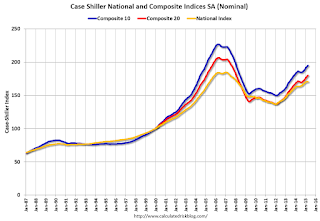 9:00 AM: S&P/Case-Shiller House Price Index for May. Although this is the May report, it is really a 3 month average of March, April and May prices.
This graph shows the nominal seasonally adjusted National Index, Composite 10 and Composite 20 indexes through the April 2015 report (the Composite 20 was started in January 2000).
The consensus is for a 5.6% year-over-year increase in the Comp 20 index for April. The Zillow forecast is for the National Index to increase 4.0% year-over-year in May.
10:00 AM: Richmond Fed Survey of Manufacturing Activity for July.
10:00 AM: Q2 Housing Vacancies and Homeownership survey.
7:00 AM: The Mortgage Bankers Association (MBA) will release the results for the mortgage purchase applications index.
10:00 AM: Pending Home Sales Index for June. The consensus is for a 1.0% increase in the index.
2:00 PM: FOMC Meeting Announcement. No change is expected to policy.
8:30 AM: Gross Domestic Product, 2nd quarter 2015 (advance estimate); Includes historical revisions. The consensus is that real GDP increased 2.9% annualized in Q2.
8:30 AM: The initial weekly unemployment claims report will be released. The consensus is for claims to increase to 272 thousand from 255 thousand.
8:30 AM: The Q2 Employment Cost Index
9:45 AM: Chicago Purchasing Managers Index for June. The consensus is for a reading of 50.0, up from 49.4 in May.
10:00 AM: University of Michigan's Consumer sentiment index (final for July). The consensus is for a reading of 94.1, up from the preliminary reading of 93.3.
Friday, July 24, 2015
Philly Fed: State Coincident Indexes increased in 40 states in June
by Calculated Risk on 7/24/2015 06:29:00 PM
From the Philly Fed:
The Federal Reserve Bank of Philadelphia has released the coincident indexes for the 50 states for June 2015. In the past month, the indexes increased in 40 states, decreased in seven, and remained stable in three, for a one-month diffusion index of 66. Over the past three months, the indexes increased in 42 states, decreased in six, and remained stable in two, for a three-month diffusion index of 72.Note: These are coincident indexes constructed from state employment data. An explanation from the Philly Fed:
The coincident indexes combine four state-level indicators to summarize current economic conditions in a single statistic. The four state-level variables in each coincident index are nonfarm payroll employment, average hours worked in manufacturing, the unemployment rate, and wage and salary disbursements deflated by the consumer price index (U.S. city average). The trend for each state’s index is set to the trend of its gross domestic product (GDP), so long-term growth in the state’s index matches long-term growth in its GDP.
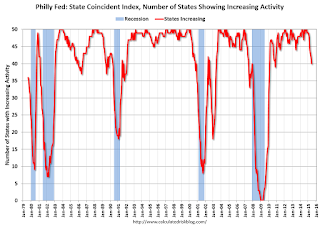 Click on graph for larger image.
This is a graph is of the number of states with one month increasing activity according to the Philly Fed. This graph includes states with minor increases (the Philly Fed lists as unchanged).
In June, 40 states had increasing activity.
It appears we are seeing weakness in several oil producing states including Alaska, Oklahoma and North Dakota - and also in other energy producing states like West Virginia.
 Here is a map of the three month change in the Philly Fed state coincident indicators. This map was all red during the worst of the recession, and is almost all green again.
 Note: Blue added for Red/Green issues.
Nomura on Q2 GDP and Annual Revision
by Calculated Risk on 7/24/2015 03:31:00 PM
A few excerpts from a research note by economists at Nomura:
Q2 GDP, first estimate (Thursday): Economic activity in Q2 bounced back after slowing in Q1. However, some factors such as low energy prices and the strong dollar likely continued to weigh on business activity. We expect the BEA to report that the rebound in activity was concentrated in the consumer, housing and government sectors. As such we forecast a 2.8% increase in Q2 GDP, with real final sales growing by 3.1% as we expect inventory investment to subtract 0.3pp from GDP growth.Earlier on GDP: Merrill on the Annual GDP Revision and Q2 GDP
The annual revisions to GDP will also be released. Revisions will be mostly applied to data between 2012 and Q1 2015. The most notable features the annual revisions will introduce are 1) the average of GDP, gross domestic income and final sales, 2) an upgrade to its presentation of exports and imports, and 3) improvements to seasonal adjustment of certain GDP components. Furthermore, our work suggests that there is material residual seasonality in top-line GDP in Q1, as it tends to be below trend due to strong seasonal patterns in defense spending. Therefore, we might see some revision to the distribution of GDP growth in the first part of this year. As such, there is more uncertainty around the Q2 GDP estimate than usual.
Comments on New Home Sales
by Calculated Risk on 7/24/2015 12:19:00 PM
The new home sales report for June was well below expectations at 482 thousand on a seasonally adjusted annual rate basis (SAAR), and there were also downward revisions to prior months. However sales are still up solidly for 2015 compared to 2014.
A key question is if there was some negative impact of higher mortgage rates on sales? - or was the decline in June mostly noise? Changes in rates would show up in New Home sales before Existing Home sales (that were strong in June) because New Home sales are reported when the contract is signed, and Existing Home sales are reported when the transaction closes. If there is an impact from higher rates, then the impact will show up in the Existing Home sales report for July or August.
Earlier: New Home Sales decreased to 482,000 Annual Rate in June.
The Census Bureau reported that new home sales this year, through June, were 274,000, not seasonally adjusted (NSA). That is up 21.2% from 226,000 sales during the same period of 2014 (NSA). That is a strong year-over-year gain for the first half of 2015!
Sales were up 18.1% year-over-year in June.

This graph shows new home sales for 2014 and 2015 by month (Seasonally Adjusted Annual Rate).
The year-over-year gain will probably be strong through July (the first seven months were especially weak in 2014), however I expect the year-over-year increases to slow later this year - but the overall year-over-year gain should be solid in 2015.
And here is another update to the "distressing gap" graph that I first started posting a number of years ago to show the emerging gap caused by distressed sales. Now I'm looking for the gap to close over the next several years.
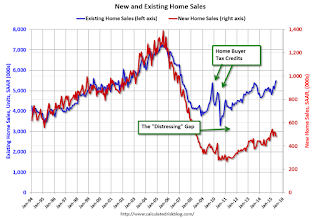
Following the housing bubble and bust, the "distressing gap" appeared mostly because of distressed sales.
I expect existing home sales to mostly move sideways over the next few years (distressed sales will continue to decline and be partially offset by more conventional / equity sales). And I expect this gap to slowly close, mostly from an increase in new home sales.
Note: Existing home sales are counted when transactions are closed, and new home sales are counted when contracts are signed. So the timing of sales is different.
New Home Sales decreased to 482,000 Annual Rate in June
by Calculated Risk on 7/24/2015 10:16:00 AM
The Census Bureau reports New Home Sales in June were at a seasonally adjusted annual rate (SAAR) of 482 thousand.
The previous three months were revised down by a total of 49 thousand (SA).
"Sales of new single-family houses in June 2015 were at a seasonally adjusted annual rate of 482,000, according to estimates released jointly today by the U.S. Census Bureau and the Department of Housing and Urban Development. This is 6.8 percent below the revised May rate of 517,000, but is 18.1 percent above the June 2014 estimate of 408,000."
 Click on graph for larger image.
The first graph shows New Home Sales vs. recessions since 1963. The dashed line is the current sales rate.
Even with the increase in sales since the bottom, new home sales are still close to the bottoms for previous recessions.
The second graph shows New Home Months of Supply.
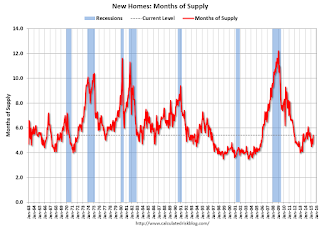 The months of supply increased in June to 5.4 months.
 The all time record was 12.1 months of supply in January 2009.
This is now in the normal range (less than 6 months supply is normal).
"The seasonally adjusted estimate of new houses for sale at the end of June was 215,000. This represents a supply of 5.4 months at the current sales rate."
 On inventory, according to the Census Bureau:
 "A house is considered for sale when a permit to build has been issued in permit-issuing places or work has begun on the footings or foundation in nonpermit areas and a sales contract has not been signed nor a deposit accepted."Starting in 1973 the Census Bureau broke this down into three categories: Not Started, Under Construction, and Completed.
The third graph shows the three categories of inventory starting in 1973.
The inventory of completed homes for sale is still low, and the combined total of completed and under construction is also low.
 The last graph shows sales NSA (monthly sales, not seasonally adjusted annual rate).
In June 2015 (red column), 45 thousand new homes were sold (NSA). Last year 38 thousand homes were sold in June. This is the highest for June since 2008.
The all time high for June was 115 thousand in 2005, and the all time low for June was 28 thousand in both 2010 and 2011.
This was well below expectations of 550,000 sales in June, however new home sales are still on pace for solid growth in 2015. I'll have more later today.
Thursday, July 23, 2015
Goldman FOMC Preview
by Calculated Risk on 7/23/2015 08:05:00 PM
Friday:
• At 10:00 AM ET, 10:00 AM: New Home Sales for June from the Census Bureau. The consensus is for an increase in sales to 550 thousand Seasonally Adjusted Annual Rate (SAAR) in June from 546 thousand in May.
A few excerpts from an FOMC preview by Goldman Sachs economist Zach Pandl:
The July 28-29 FOMC meeting is shaping up to be the calm before the storm. Short-term interest rate markets imply a zero probability that the committee will raise policy rates next week, but show a high likelihood of at least one hike before the end of the year. Thus, although changes to the stance of policy look very unlikely, the upcoming statement will be closely watched for any clues on the precise timing of liftoff (we continue to see December as most likely). We will be focused on three main items:
...
• First, the description of economic conditions will likely acknowledge the decline in the unemployment rate. We expect the statement to drop its prior reference to stable oil prices, but to leave other comments about inflation unchanged.
• Second, we do not expect additional language intended to prepare for rate hikes in the statement. In 2004 the FOMC used the “measured” phrase for this purpose, but Fed Chair Yellen downplayed the need for new guidance at the June press conference. A change along these lines is a risk for next week, however.
• Third, we do not expect dissents, but see them as a risk from President Evans (dovish) and President Lacker (hawkish).
Merrill on the Annual GDP Revision and Q2 GDP
by Calculated Risk on 7/23/2015 05:37:00 PM
Excerpts from a research piece by Michelle Meyer at Merrill Lynch:
The moment of truthAnd on Q2:
• The annual revision to GDP growth on July 30th will adjust estimates of growth over the past few years. If growth is indeed revised higher it would help solve the puzzle of low productivity growth.
• This will also be the first release of the new GDP and GDI composite. This will show a stronger trend of growth given that GDI has outpaced GDP recently.
• Taking a step back and examining a range of indicators reveals an economy expanding at a mid-2% pace, largely consistent with the Fed’s forecasts.
...
On July 30th, along with the first release of 2Q GDP, the Bureau of Economic Analysis (BEA) will release the 2015 annual NIPA revision. We will be looking for the following:
1. Will GDP growth be revised higher over the past few years? If so, this would imply faster productivity growth, which has been puzzlingly slow.
2. How will the revision to seasonal factors adjust the “residual seasonality” issue to 1Q GDP growth over the years?
3. Will the new aggregated GDP and GDI figure take the spotlight away from GDP?
Although it is hard to say with any certainty, we believe GDP growth is likely to be revised up modestly. This will likely leave the Fed comfortable arguing that the economy is making progress closing the output gap, allowing a gradual hiking cycle to commence.
The first estimate of 2Q GDP is likely to show growth of 3.0%, which would be a bounce from the contraction of 0.2% in 1Q. However, it is important to remember that the history will be revised along with this report.
Black Knight's First Look at June: Foreclosure Inventory at Lowest Level Since 2007
by Calculated Risk on 7/23/2015 02:45:00 PM
From Black Knight: Black Knight Financial Services’ “First Look” at June Mortgage Data: Foreclosure Inventory at Lowest Level Since 2007, Still Three Times “Normal” Rate
According to Black Knight's First Look report for June, the percent of loans delinquent decreased 3% in June compared to May, and declined 15.5% year-over-year.
The percent of loans in the foreclosure process declined 2% in June and were down 23% over the last year.
Black Knight reported the U.S. mortgage delinquency rate (loans 30 or more days past due, but not in foreclosure) was 4.82% in June, down from 4.96% in May.
The percent of loans in the foreclosure process declined in June to 1.46%. This was the lowest level of foreclosure inventory since 2007.
The number of delinquent properties, but not in foreclosure, is down 439,000 properties year-over-year, and the number of properties in the foreclosure process is down 212,000 properties year-over-year.
Black Knight will release the complete mortgage monitor for June in early August.
| Black Knight: Percent Loans Delinquent and in Foreclosure Process | ||||
|---|---|---|---|---|
| June 2015 | May 2015 | June 2014 | June 2013 | |
| Delinquent | 4.82% | 4.96% | 5.70% | 6.68% |
| In Foreclosure | 1.46% | 1.49% | 1.88% | 2.93% |
| Number of properties: | ||||
| Number of properties that are 30 or more, and less than 90 days past due, but not in foreclosure: | 1,549,000 | 1,591,000 | 1,728000 | 1,983,000 |
| Number of properties that are 90 or more days delinquent, but not in foreclosure: | 895,000 | 922,000 | 1,155,000 | 1,345,000 |
| Number of properties in foreclosure pre-sale inventory: | 739,000 | 754,000 | 951,000 | 1,458,000 |
| Total Properties | 3,183,000 | 3,268,000 | 3,834,000 | 4,785,000 |
Kansas City Fed: Regional Manufacturing Activity Declined Again in July
by Calculated Risk on 7/23/2015 11:00:00 AM
From the Kansas City Fed: Tenth District Manufacturing Activity Declined Again
The Federal Reserve Bank of Kansas City released the July Manufacturing Survey today. According to Chad Wilkerson, vice president and economist at the Federal Reserve Bank of Kansas City, the survey revealed that Tenth District manufacturing activity declined again in July but less so than in previous months.Some of this recent decline in the Kansas City region has been due to lower oil prices.
“Our headline index was closer to zero than in May or June but was still negative, indicating further contraction in regional factory activity. However, firms expect a modest pickup in activity in coming months.”
...
Tenth District manufacturing activity declined again in July, but less so than in previous months. Producers’ remained slightly optimistic about future activity, although the majority of contacts indicated difficulties finding qualified labor. Most price indexes indicated continued rising prices, but the rate of increase slowed a bit for raw materials.
The month-over-month composite index was -7 in July, up from -9 in June and -13 in May ... the new orders index eased from -3 to -6, and the employment index dropped to its lowest level since April 2009, with many firms noting difficulties finding qualified workers.
emphasis added


