by Calculated Risk on 6/23/2015 09:09:00 AM
Tuesday, June 23, 2015
FHFA: House Prices increased 0.3% in April, Up 5.3% Year-over-year
This house price index is only for houses with Fannie or Freddie mortgages.
From the FHFA: FHFA House Price Index Up 0.3 Percent in April 2015
U.S. house prices rose in April, up 0.3 percent on a seasonally adjusted basis from the previous month, according to the Federal Housing Finance Agency (FHFA) monthly House Price Index (HPI). The previously reported 0.3 percent change in March remains unchanged.
The FHFA HPI is calculated using home sales price information from mortgages sold to or guaranteed by Fannie Mae and Freddie Mac. From April 2014 to April 2015, house prices were up 5.3 percent. The U.S. index is 2.3 percent below its March 2007 peak and is roughly the same as the February 2006 index level.
For the nine census divisions, seasonally adjusted monthly price changes from March 2015 to April 2015 ranged from -0.8 percent in the East North Central division to +1.4 percent in the West North Central division. The 12-month changes were all positive, ranging from +2.3 percent in the Middle Atlantic division to +7.5 percent in the Pacific division.
emphasis added
 This graph is from the FHFA and shows nominal house prices in April were 2.3% below the March 2007 peak for this index.
However, these are nominal prices. In real terms (inflation adjusted), national prices are still around 20% below the previous peak.
Monday, June 22, 2015
Tuesday: New Home Sales, Durable Goods and More
by Calculated Risk on 6/22/2015 07:11:00 PM
Update on Greece, from the WSJ: Greek Bailout Proposals Lift Hopes of Deal
From the Financial Times: Painful reality — creditors will support Greece in any case
Hopefully a deal will be reached.
Tuesday:
Philly Fed: State Coincident Indexes increased in 35 states in May
by Calculated Risk on 6/22/2015 04:57:00 PM
From the Philly Fed:
The Federal Reserve Bank of Philadelphia has released the coincident indexes for the 50 states for May 2015. In the past month, the indexes increased in 35 states, decreased in 10, and remained stable in five, for a one-month diffusion index of 50. Over the past three months, the indexes increased in 41 states, decreased in eight, and remained stable in one, for a three-month diffusion index of 66.
A Few Random Comments on May Existing Home Sales
by Calculated Risk on 6/22/2015 12:22:00 PM
First, last month housing economist Tom Lawler pointed out the data in the South looked funny, see: The “Curious Case” of Existing Home Sales in the South in April. Sure enough, sales for April were revised up, with all of the upward revision coming in the South.
Second, as always, new home sales are more important for jobs and the economy than existing home sales. Since existing sales are existing stock, the only direct contribution to GDP is the broker's commission. There is usually some additional spending with an existing home purchase - new furniture, etc - but overall the economic impact is small compared to a new home sale.
Third, in general I'd ignore the median sales price because it is impacted by the mix of homes sold (more useful are the repeat sales indexes like Case-Shiller or CoreLogic). The NAR reported the median sales price was $228,700 in May, just below the median peak of $230,400 in July 2006. That is 9 years ago, so in real terms, median prices are close to 20% below the previous peak. Not close.
Inventory is still very low (up 1.8% year-over-year in May). More inventory would probably mean smaller price increases and slightly higher sales, and less inventory means lower sales and somewhat larger price increases. This will be important to watch over the next few months during the Spring / Summer buying season.
Note: I'm hearing reports of rising inventory in some mid-to-higher priced areas.
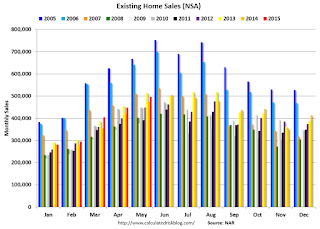
The following graph shows existing home sales Not Seasonally Adjusted (NSA).

Sales NSA in May (red column) were above May 2014, and were below May 2013 (NSA).
Earlier:
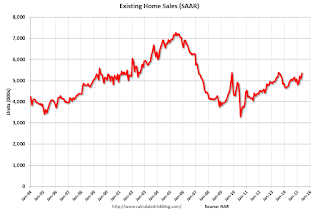
• Existing Home Sales in May: 5.35 million SAAR, Inventory up 1.8% Year-over-year
Existing Home Sales in May: 5.35 million SAAR, Inventory up 1.8% Year-over-year
by Calculated Risk on 6/22/2015 10:10:00 AM
The NAR reports: Existing-Home Sales Bounce Back Strongly in May as First-time Buyers Return
Total existing-home sales, which are completed transactions that include single-family homes, townhomes, condominiums and co-ops, rose 5.1 percent to a seasonally adjusted annual rate of 5.35 million in May from an upwardly revised 5.09 million in April. Sales have now increased year-over-year for eight consecutive months and are 9.2 percent above a year ago (4.90 million)....
Total housing inventory at the end of May increased 3.2 percent to 2.29 million existing homes available for sale, and is 1.8 percent higher than a year ago (2.25 million). Unsold inventory is at a 5.1-month supply at the current sales pace, down from 5.2 months in April.
 Click on graph for larger image.
Chicago Fed: "Index shows economic growth slightly below average in May"
by Calculated Risk on 6/22/2015 08:38:00 AM
The Chicago Fed released the national activity index (a composite index of other indicators): Index shows economic growth slightly below average in May
The Chicago Fed National Activity Index (CFNAI) moved up to –0.17 in May from –0.19 in April. Two of the four broad categories of indicators that make up the index increased from April, but only the employment, unemployment, and hours category made a positive contribution to the index in May.This graph shows the Chicago Fed National Activity Index (three month moving average) since 1967.
The index’s three-month moving average, CFNAI-MA3, increased slightly to –0.16 in May from –0.20 in April. May’s CFNAI-MA3 suggests that growth in national economic activity was somewhat below its historical trend. The economic growth reflected in this level of the CFNAI-MA3 suggests subdued inflationary pressure from economic activity over the coming year.
emphasis added
Sunday, June 21, 2015
Monday: Existing Home Sales
by Calculated Risk on 6/21/2015 08:24:00 PM
First a couple of articles on Greece (this is a key week).
From the WSJ: Greece Pitches Last-Ditch Bailout Plan as Crisis Nears Endgame
From Larry Summers at the Financial Times: Greece is no longer about numbers. It is about the high politics of Europe
Pretty grim.
Monday:
• At 8:30 AM ET, the Chicago Fed National Activity Index for May. This is a composite index of other data.
Update: The Inland Empire Bust and Recovery
by Calculated Risk on 6/21/2015 12:36:00 PM
One of the areas I focused on during the housing bubble and subsequent bust was California's Inland Empire.
Way back in 2006 I disagreed with some analysts on the outlook for the Inland Empire. I wrote:
As the housing bubble unwinds, housing related employment will fall; and fall dramatically in areas like the Inland Empire. The more an area is dependent on housing, the larger the negative impact on the local economy will be.
Saturday, June 20, 2015
Schedule for Week of June 21, 2015
by Calculated Risk on 6/20/2015 08:41:00 AM
The key reports this week are May New Home sales on Tuesday, the 3rd estimate of Q1 GDP on Wednesday, and May Existing Home Sales on Monday.
For manufacturing, the May Richmond and Kansas City Fed surveys will be released this week.
8:30 AM ET: Chicago Fed National Activity Index for May. This is a composite index of other data.
 10:00 AM: Existing Home Sales for May from the National Association of Realtors (NAR).
 Friday, June 19, 2015
Mortgage News Daily: Mortgage Rates Near June Lows
by Calculated Risk on 6/19/2015 04:19:00 PM
From Matthew Graham at Mortgage News Daily: Mortgage Rates Near June Lows
Mortgage rates took a few more steps in the right direction today and have now made it back to levels not seen since the beginning of June. Only the first 2 days of the month were any better. That said, the month began with a quick jump to the highest rates in more than 8 months, and they've only been falling gradually since then.


