by Calculated Risk on 6/02/2015 09:41:00 AM
Tuesday, June 02, 2015
CoreLogic: House Prices up 6.8% Year-over-year in April
Notes: This CoreLogic House Price Index report is for April. The recent Case-Shiller index release was for March. The CoreLogic HPI is a three month weighted average and is not seasonally adjusted (NSA).
From CoreLogic: CoreLogic Reports National Homes Prices Rose by 6.8 Percent Year Over Year in April 2015
CoreLogic® ... today released its April 2015 CoreLogic Home Price Index (HPI®) which shows that home prices nationwide, including distressed sales, increased by 6.8 percent in April 2015 compared with April 2014. This change represents 38 months of consecutive year-over-year increases in home prices nationally. On a month-over-month basis, home prices nationwide, including distressed sales, increased by 2.7 percent in April 2015 compared with March 2015.
Including distressed sales, 30 states plus the District of Columbia were at or within 10 percent of their peak prices in April. Eight states and the District of Columbia reached new price peaks not experienced since January 1976 when the CoreLogic HPI started. These states include Alaska, Colorado, Nebraska, New York, Oklahoma, Tennessee, Texas and Wyoming.
Excluding distressed sales, home prices increased by 6.8 percent in April 2015 compared with April 2014 and increased by 2.3 percent month over month compared with March 2015. ...
“For the first four months of 2015, home sales were up 9 percent compared to the same period a year ago,” said Frank Nothaft, chief economist for CoreLogic. “One byproduct of the increased sales activity is rising house prices, and, as a result, month-over-month home prices are up almost 3 percent for April 2015 and up more than 6 percent from a year ago.”
emphasis added
 Click on graph for larger image.
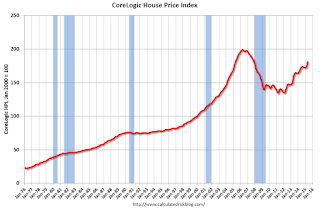
 This graph shows the national CoreLogic HPI data since 1976. January 2000 = 100.
The index was up 2.7% in April (NSA), and is up 6.8% over the last year.
This index is not seasonally adjusted, and this was a solid month-to-month increase.
 The second graph is from CoreLogic. The year-over-year comparison has been positive for thirty eight consecutive months suggesting house prices bottomed early in 2012 on a national basis (the bump in 2010 was related to the tax credit).
The YoY increase had been moving sideways over the previous 7 or 8 months, but has picked up a little recently.
Monday, June 01, 2015
Financial Times: Greek Discussion Ends, Not "Take it or leave it" Deal
by Calculated Risk on 6/01/2015 07:48:00 PM
Tuesday:
• All day: Light vehicle sales for May. The consensus is for light vehicle sales to increase to 17.0 million SAAR in May from 16.5 million in April (Seasonally Adjusted Annual Rate).
• At 10:00 AM, Manufacturers' Shipments, Inventories and Orders (Factory Orders) for April. The consensus is a 0.1% decrease in orders
From the Financial Times: Greek bailout monitors hold emergency summit
Officials insisted that if a compromise is reached in Berlin, it will not be used as a “take it or leave it” ultimatum for Athens, but rather an outline to be presented to Alexis Tsipras, the Greek prime minister, for a “quick reaction.”The talks apparently ended at 11:30 PM Berlin time. The details will be sent to Tsipras for his response. If there is a compromise, it sounds like the ESM (Eurozone's bailout fund) will take the hit, not the IMF or ECB.
excerpt with permission
The article also mentions a possible solution to cover debt payments over the summer.
Greece Update: "Take it or leave it" offer?
by Calculated Risk on 6/01/2015 03:52:00 PM
From Reuters: Draghi, Lagarde joining Berlin meeting on Greece - officials
European Central Bank President Mario Draghi and IMF chief Christine Lagarde will join the leaders of Germany, France, and the European Commission for talks on Monday evening in Berlin on Greece, European Union officials said."How to negotiate" is the key sentence. The rumor is that the Germans want to make a "take it or leave it" final offer. That would probably mean a referendum in Greece. Most likely the "offer" would be more crushing austerity, and the Greek vote would probably be no.
The goal of the meeting was to reach a joint position on how to negotiate with Greece, the officials said.
It would be better to find a compromise that keeps Greece in the eurozone - and doesn't make the depression too much worse. Good luck.
Construction Spending increased 2.2% in April
by Calculated Risk on 6/01/2015 12:20:00 PM
Earlier today, the Census Bureau reported that overall construction spending increased in April:
The U.S. Census Bureau of the Department of Commerce announced today that construction spending during April 2015 was estimated at a seasonally adjusted annual rate of $1,006.1 billion, 2.2 percent above the revised March estimate of $984.0 billion. The April figure is 4.8 percent above the April 2014 estimate of $960.3 billion.Both Private and public spending increased:
Spending on private construction was at a seasonally adjusted annual rate of $725.2 billion, 1.8 percent above the revised March estimate of $712.1 billion. ...Note: Non-residential for offices and hotels is generally increasing, but spending for oil and gas has been declining. Early in the recovery, there was a surge in non-residential spending for oil and gas (because oil prices increased), but now, with falling prices, oil and gas is a drag on overall construction spending.
In April, the estimated seasonally adjusted annual rate of public construction spending was $280.9 billion, 3.3 percent above the revised March estimate of $271.9 billion.
emphasis added
As an example, construction spending for private lodging is up 20% year-over-year, whereas spending for power (includes oil and gas) construction peaked in mid-2014 and is down 31% year-over-year.
 Click on graph for larger image.
This graph shows private residential and nonresidential construction spending, and public spending, since 1993. Note: nominal dollars, not inflation adjusted.
Private residential spending has been moving sideways recently, and is 48% below the bubble peak.
Non-residential spending is 14% below the peak in January 2008.
Public construction spending is now 14% below the peak in March 2009 and about 7% above the post-recession low.
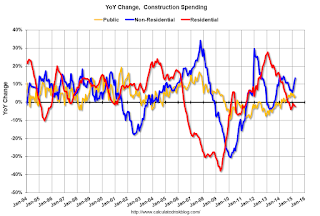
 The second graph shows the year-over-year change in construction spending.
On a year-over-year basis, private residential construction spending is down 2%. Non-residential spending is up 13% year-over-year. Public spending is up 3% year-over-year.
Looking forward, all categories of construction spending should increase in 2015. Residential spending is still very low, non-residential is starting to pickup (except oil and gas), and public spending has probably hit bottom after several years of austerity.
This was well above the consensus forecast of a 0.7% increase, and spending for February and March were revised up. A solid report.
ISM Manufacturing index increased to 52.8 in May
by Calculated Risk on 6/01/2015 10:00:00 AM
The ISM manufacturing index suggested expansion in May. The PMI was at 52.8% in May, up from 51.5% in April. The employment index was at 51.7%, up from 48.3% in April, and the new orders index was at 55.8%, up from 53.5%.
From the Institute for Supply Management: May 2015 Manufacturing ISM® Report On Business®
Economic activity in the manufacturing sector expanded in May for the 29th consecutive month, and the overall economy grew for the 72nd consecutive month, say the nation’s supply executives in the latest Manufacturing ISM® Report On Business®.
The report was issued today by Bradley J. Holcomb, CPSM, CPSD, chair of the Institute for Supply Management® (ISM®) Manufacturing Business Survey Committee. "The May PMI® registered 52.8 percent, an increase of 1.3 percentage points over the April reading of 51.5 percent. The New Orders Index registered 55.8 percent, an increase of 2.3 percentage points from the reading of 53.5 percent in April. The Production Index registered 54.5 percent, 1.5 percentage points below the April reading of 56 percent. The Employment Index registered 51.7 percent, 3.4 percentage points above the April reading of 48.3 percent, reflecting growing employment levels from April. Inventories of raw materials registered 51.5 percent, an increase of 2 percentage points from the April reading of 49.5 percent. The Prices Index registered 49.5 percent, 9 percentage points above the April reading of 40.5 percent, indicating lower raw materials prices for the seventh consecutive month. Comments from the panel carry a positive tone in terms of an improving economy, increasing demand, and improving flow of goods through the West Coast ports. Also noted; however, are continuing concerns over the price of the US dollar and challenges affecting markets related to oil and gas industries."
emphasis added
 Click on graph for larger image.
Here is a long term graph of the ISM manufacturing index.
This was above expectations of 51.8%, and indicates slow expansion in May.


