by Calculated Risk on 5/27/2015 08:06:00 PM
Wednesday, May 27, 2015
Thursday: Pending Home Sales, Unemployment Claims
From Reuters: EU officials dismiss Greek statement on aid agreement being drafted
Greece's government on Wednesday said it is starting to draft an agreement with creditors that would pave the way for aid, but European officials quickly dismissed that as wishful thinking.Thursday:
...
But European Commission Vice President Valdis Dombrovskis said the two sides still had some way to go before any agreement could be drawn up.
"We are working very intensively to ensure a staff-level agreement," he said. "We are still not there yet."
Other officials in the euro zone, speaking to Reuters on condition of anonymity, were more blunt. One called the Greek remarks "nonsense". Another said: "I wish it were true."
• At 8:30 AM ET, the initial weekly unemployment claims report will be released. The consensus is for claims to decrease to 270 thousand from 274 thousand.
• At 10:00 AM, the Pending Home Sales Index for April. The consensus is for a 0.8% increase in the index.
Zillow Forecast: Expect Case-Shiller National House Price Index up 4.0% year-over-year change in April
by Calculated Risk on 5/27/2015 03:22:00 PM
The Case-Shiller house price indexes for March were released this yesterday. Zillow forecasts Case-Shiller a month early, and I like to check the Zillow forecasts since they have been pretty close.
From Zillow: Expect More of the Same from Case-Shiller in April
The March S&P/Case-Shiller (SPCS) data published [yesterday] showed home prices continuing to appreciate at around 5 percent annually for both the 10- and 20- City Indices, and roughly 4 percent for the national index. March marks the seventh consecutive month in which the national home price index has appreciated at a less than 5 percent annual appreciation rate (seasonally adjusted).So the year-over-year change in for April Case-Shiller National index will be about the same as in the March report.
In March, the 10-City Index appreciated at an annual rate of 4.7 percent, compared to 5.0 percent for the 20-City Index (SA). The non-seasonally adjusted (NSA) 10-City Index was up 0.8 percent month-over-month, while the 20-City index rose 0.9 percent (NSA) from February to March. We expect the change from March to April to show increases of more than 1 percent (NSA) for both the 10- and 20- City Indices.
All forecasts are shown in the table below. These forecasts are based on the March SPCS data release and the April 2015 Zillow Home Value Index (ZHVI), published May 21. Officially, the SPCS Composite Home Price Indices for March will not be released until Tuesday, June 30.
| Zillow Case-Shiller Forecast | ||||||
|---|---|---|---|---|---|---|
| Case-Shiller Composite 10 | Case-Shiller Composite 20 | Case-Shiller National | ||||
| NSA | SA | NSA | SA | NSA | SA | |
| March Actual YoY | 4.7% | 4.7% | 5.0% | 5.0% | 4.1% | 4.1% |
| April Forecast YoY | 4.9% | 4.9% | 5.2% | 5.2% | 4.0% | 4.0% |
| April Forecast MoM | 1.2% | 0.5% | 1.3% | 0.6% | 1.0% | 0.0% |
From Zillow:
Annual appreciation in the Zillow Home Value Index (ZHVI) peaked in April 2014 and has declined since then. In April, the U.S. ZHVI rose 3 percent year-over-year, one percentage point lower than the annual change in rents (4 percent). The April Zillow Home Value Forecast calls for a 2 percent rise in home values through April 2016. Further details on our forecast of home values can be found here.
FDIC: Fewer Problem banks, Residential REO Declines in Q1
by Calculated Risk on 5/27/2015 11:55:00 AM
The FDIC released the Quarterly Banking Profile for Q1 today:
Commercial banks and savings institutions insured by the Federal Deposit Insurance Corporation (FDIC) reported aggregate net income of $39.8 billion in the first quarter of 2015, up $2.6 billion (6.9 percent) from a year earlier. The increase in earnings was mainly attributable to a $4.3 billion rise in net operating revenue (net interest income plus total noninterest income). Financial results for the first quarter of 2015 are included in the FDIC's latest Quarterly Banking Profile released today.
...
"Problem List" Continues to Shrink: The number of banks on the FDIC's Problem List fell from 291 to 253 during the first quarter. This is the smallest number of banks on the Problem List in six years. The number of problem banks was down 72 percent from the peak of 888 in the first quarter of 2011. Total assets of problem banks fell from $86.7 billion to $60.3 billion during the first quarter.
Deposit Insurance Fund (DIF) Rises $2.5 Billion to $65.3 Billion: The DIF increased from $62.8 billion to $65.3 billion in the first quarter, largely driven by $2.2 billion in assessment income. The DIF reserve ratio rose to 1.03 percent from 1.01 percent during the quarter.
 Click on graph for larger image.
The FDIC reported the number of problem banks declined (Note: graph shows problem banks for Q1 2015, and year end prior to 2015):
The number of insured commercial banks and savings institutions filing quarterly financial reports declined from 6,509 to 6,419 in the first quarter. Mergers absorbed 86 institutions, while four insured institutions failed. For a fifth consecutive quarter, no new charters were added. The number of full-time equivalent employees declined by 5,349 to 2,042,596. The number of institutions on the FDIC’s “Problem List” declined for the 16th consecutive quarter, falling from 291 to 253. Total assets of problem institutions fell from $86.7 billion to $60.3 billion.
 The dollar value of 1-4 family residential Real Estate Owned (REOs, foreclosure houses) declined from $5.98 billion in Q4 2014 to $5.72 billion in Q1. This is the lowest level of REOs since Q3 2007.
This graph shows the nominal dollar value of Residential REO for FDIC insured institutions. Note: The FDIC reports the dollar value and not the total number of REOs.
BLS: Twenty-Three States had Unemployment Rate Decreases in April
by Calculated Risk on 5/27/2015 10:10:00 AM
From the BLS: Regional and State Employment and Unemployment Summary
Regional and state unemployment rates were little changed in April. Twenty-three states and the District of Columbia had unemployment rate decreases from March, 11 states had increases, and 16 states had no change, the U.S. Bureau of Labor Statistics reported today.
...
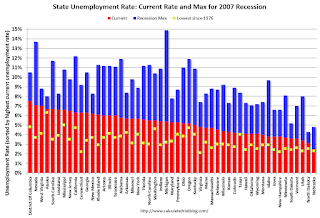
Nebraska had the lowest jobless rate in April, 2.5 percent. Nevada had the highest rate among the states, 7.1 percent. The District of Columbia had a rate of 7.5 percent.
 Click on graph for larger image.
This graph shows the current unemployment rate for each state (red), and the max during the recession (blue). All states are well below the maximum unemployment rate for the recession.
The size of the blue bar indicates the amount of improvement. The yellow squares are the lowest unemployment rate per state since 1976.
The states are ranked by the highest current unemployment rate. Nevada, at 7.1%, had the highest state unemployment rate although D.C was higher.
 The second graph shows the number of states (and D.C.) with unemployment rates at or above certain levels since January 2006. At the worst of the employment recession, there were 10 states with an unemployment rate at or above 11% (red).
Currently no state has an unemployment rate at or above 8% (light blue); Only two states (Nevada and West Virginia) and D.C. are still at or above 7% (dark blue).
MBA: Mortgage Refinance Applications Decrease in Latest Weekly Survey, Purchase Index up 14% YoY
by Calculated Risk on 5/27/2015 07:00:00 AM
From the MBA: Mortgage Applications Decrease in Latest MBA Weekly Survey
Mortgage applications decreased 1.6 percent from one week earlier, according to data from the Mortgage Bankers Association’s (MBA) Weekly Mortgage Applications Survey for the week ending May 22, 2015. ...
The Refinance Index decreased 4 percent from the previous week. The seasonally adjusted Purchase Index increased 1 percent from one week earlier. The unadjusted Purchase Index was essentially unchanged compared with the previous week and was 14 percent higher than the same week one year ago.
The average contract interest rate for 30-year fixed-rate mortgages with conforming loan balances ($417,000 or less) increased to 4.07 percent from 4.04 percent, with points increasing to 0.35 from 0.32 (including the origination fee) for 80 percent loan-to-value ratio (LTV) loans.
emphasis added
 Click on graph for larger image.
The first graph shows the refinance index.
2014 was the lowest year for refinance activity since year 2000.
It would take much lower rates - below 3.5% - to see a significant refinance boom this year.
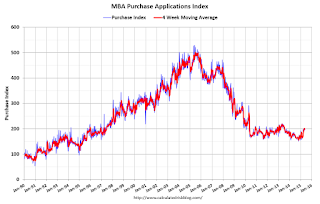
 The second graph shows the MBA mortgage purchase index.
 According to the MBA, the unadjusted purchase index is 14% higher than a year ago.


