by Calculated Risk on 2/18/2015 09:24:00 AM
Wednesday, February 18, 2015
Fed: Industrial Production increased 0.2% in January
From the Fed: Industrial production and Capacity Utilization
Industrial production increased 0.2 percent in January after decreasing 0.3 percent in December. The rates of change in output for September through December are all slightly lower than previously published; even so, production is estimated to have advanced at an annual rate of 4.3 percent in the fourth quarter of last year. In January, manufacturing output moved up 0.2 percent and was 5.6 percent above its year-earlier level. The index for mining decreased 1.0 percent, with the decline more than accounted for by a substantial drop in the index for oil and gas well drilling and related support activities. The output of utilities increased 2.3 percent. At 106.2 percent of its 2007 average, total industrial production in January was 4.8 percent above its level of a year earlier. Capacity utilization for the industrial sector was unchanged in January at 79.4 percent, a rate that is 0.7 percentage point below its long-run (1972–2014) average.
emphasis added
 Click on graph for larger image.
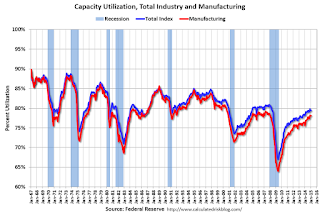
This graph shows Capacity Utilization. This series is up 12.5 percentage points from the record low set in June 2009 (the series starts in 1967).
Capacity utilization at 79.4% is 0.7% below the average from 1972 to 2012 and below the pre-recession level of 80.8% in December 2007.
Note: y-axis doesn't start at zero to better show the change.
 The second graph shows industrial production since 1967.
Industrial production increased 0.2% in January to 106.2. This is 26.8% above the recession low, and 5.4% above the pre-recession peak.
This was below expectations, and there were downward revisions to prior months.
Housing Starts decreased to 1.065 Million Annual Rate in January
by Calculated Risk on 2/18/2015 08:39:00 AM
From the Census Bureau: Permits, Starts and Completions
Housing Starts:
Privately-owned housing starts in January were at a seasonally adjusted annual rate of 1,065,000. This is 2.0 percent below the revised December estimate of 1,087,000, but is 18.7 percent above the January 2014 rate of 897,000.
Single-family housing starts in January were at a rate of 678,000; this is 6.7 percent below the revised December figure of 727,000. The January rate for units in buildings with five units or more was 381,000.
emphasis added
Building Permits:
Privately-owned housing units authorized by building permits in January were at a seasonally adjusted annual rate of 1,053,000. This is 0.7 percent below the revised December rate of 1,060,000, but is 8.1 percent above the January 2014 estimate of 974,000.
Single-family authorizations in January were at a rate of 654,000; this is 3.1 percent (±0.9%) below the revised December figure of 675,000. Authorizations of units in buildings with five units or more were at a rate of 372,000 in January.
 Click on graph for larger image.
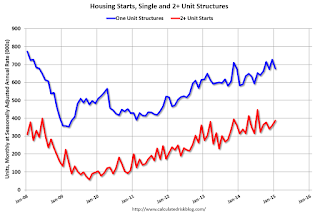
The first graph shows single and multi-family housing starts for the last several years.
Multi-family starts (red, 2+ units) increased slightly in January. Multi-family starts are up 23% year-over-year.
Single-family starts (blue) decreased slightly in January and are up 16% year-over-year.
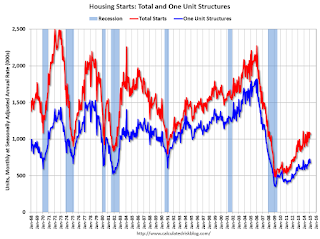
The second graph shows total and single unit starts since 1968.
 The second graph shows the huge collapse following the housing bubble, and - after moving sideways for about two years and a half years - housing is now recovering (but still historically low),
This was close to expectations of 1.070 million starts in January, although starts in November and December were revised down. Overall this was a decent report with housing starts up almost 19% year-over-year (starts were weak in early 2014). I'll have more later ...
MBA: Mortgage Applications Decrease in Latest MBA Weekly Survey
by Calculated Risk on 2/18/2015 07:00:00 AM
From the MBA: Mortgage Applications Decrease in Latest MBA Weekly Survey
Mortgage applications decreased 13.2 percent from one week earlier, according to data from the Mortgage Bankers Association’s (MBA) Weekly Mortgage Applications Survey for the week ending February 13, 2015. ...
The Refinance Index decreased 16 percent from the previous week. The seasonally adjusted Purchase Index decreased 7 percent from one week earlier.
...
“Mortgage rates increased to their highest level since the beginning of the year last week, and application volume dropped sharply as a result, particularly for refinances. The market index declined to its lowest level since the week ending January 2nd as purchase application activity decreased seven percent and refinance applications decreased 16 percent. Refinance volume fell particularly for larger loans, as evidenced by the decline of almost $25,000 in the average loan size for a refinance loan,” said Mike Fratantoni, MBA’s Chief Economist.
The average contract interest rate for 30-year fixed-rate mortgages with conforming loan balances ($417,000 or less) increased to 3.93 percent from 3.84 percent, with points increasing to 0.35 from 0.31 (including the origination fee) for 80 percent loan-to-value ratio (LTV) loans.
emphasis added
 Click on graph for larger image.
The first graph shows the refinance index.
2014 was the lowest year for refinance activity since year 2000.
2015 will probably see more refinance activity than in 2014, but not a large refinance boom.
 The second graph shows the MBA mortgage purchase index.
 According to the MBA, the unadjusted purchase index is up 1% from a year ago.
Tuesday, February 17, 2015
Wednesday: Housing Starts, Industrial Production, PPI, FOMC Minutes
by Calculated Risk on 2/17/2015 07:01:00 PM

A cool map of ships anchored in the Long Beach area from Ron Schweitzer, of Long Beach, CA.
Ron captured this yesterday, on a return trip from Catalina, using the iPhone app Boat Beacon. This app shows all the big commercial vessels on your phone, and Ron wrote that he had to “thread the needle” to get back to the marina!
Wednesday:
• At 7:00 AM ET, the Mortgage Bankers Association (MBA) will release the results for the mortgage purchase applications index.
• At 8:30 AM, Housing Starts for January. Total housing starts were at 1.089 million (SAAR) in December. Single family starts were at 679 thousand SAAR in December. The consensus is for total housing starts to decrease to 1.070 million (SAAR) in January.
• At 8:30 AM, The Producer Price Index for January from the BLS. The consensus is for a 0.4% decrease in prices, and a 0.1% increase in core PPI.
• At 9:15 AM, The Fed will release Industrial Production and Capacity Utilization for January. The consensus is for a 0.4% increase in Industrial Production, and for Capacity Utilization to increase to 79.9%.
• During the day: The AIA's Architecture Billings Index for January (a leading indicator for commercial real estate).
• At 2:00 PM, FOMC Minutes for Meeting of January 27-28, 2015
DataQuick: Southern California January Home Sales down 6% Year-over-year
by Calculated Risk on 2/17/2015 04:22:00 PM
From DataQuick: Southern California Home Sales Decline; Median Sale Price Still Up Year Over Year
Home sales in January fell sharply from December, as they normally do, and dipped modestly from a year earlier, marking the 14th month in the last 16 to post a year-over-year sales decline. ... A total of 13,560 new and resale houses and condos sold in Los Angeles, Riverside, San Diego, Ventura, San Bernardino and Orange counties in January 2015. That was down month over month 29.4 percent from 19,205 sales in December 2014, and down year over year 6.3 percent from 14,471 sales in January 2014, according to CoreLogic DataQuick data.January is a seasonal slow month, so I wouldn't read too much into the sales decline.
"The January and February statistics are always interesting, and sometimes a bit strange, but they're not necessarily a good indication of what's to come," said Andrew LePage, data analyst for CoreLogic DataQuick. "That's largely because many traditional buyers and sellers drop out of the housing market during the holidays and mid winter, and therefore don’t close deals during those months. In recent years that's led to somewhat higher concentrations of investor activity for January and February, and we saw that again last month. Heading into spring it will be interesting to see whether price appreciation and other factors will finally release a lot of the pent-up supply of homes out there. More owners have gained enough equity to sell and buy another home and more will be satisfied with how much their homes can fetch. At the same time, recent gains in job and income growth, coupled with low mortgage rates, could stoke demand and put significant pressure on prices unless we see a meaningful jump in inventory.”
...
Foreclosure resales represented 5.7 percent of the resale market in January. That was up from a revised 5.3 percent in December 2014 and down from 6.6 percent in January 2014. In recent months the foreclosure resale rate has been the lowest since early 2007. In the current cycle, foreclosure resales hit a high of 56.7 percent in February 2009. Foreclosure resales are purchased homes that have been previously foreclosed upon in the prior 12 months.
Short sales made up an estimated 6.5 percent of resales in January, up from a revised 6.2 in December 2014 and down from 10.7 percent in January 2014. Short sales are transactions in which the sale price fell short of what was owed on the property.
emphasis added
A couple of key points from LePage: 1) the percent of distress sales usually increases in January, because traditional sales fall off sharply - so it is important to look at the year-over-year change in distressed sales (down to 12.2% from 17.3% a year ago), and 2) we might see more upward price pressure unless inventory increases.


