by Calculated Risk on 10/22/2014 08:30:00 AM
Wednesday, October 22, 2014
BLS: CPI increases 0.1% in September, Core CPI 0.1%, Cost-Of-Living Adjustment 1.7%
The Consumer Price Index for All Urban Consumers (CPI-U) increased 0.1 percent in September on a seasonally adjusted basis, the U.S. Bureau of Labor Statistics reported today. Over the last 12 months, the all items index increased 1.7 percent before seasonal adjustment.I'll post a graph later today after the Cleveland Fed releases the median and trimmed-mean CPI. This was close to the consensus forecast of no change for CPI, and a 0.1% increase in core CPI.
...
The index for all items less food and energy increased 0.1 percent in September. ... The 12-month change in the index for all items less food and energy also remained at 1.7 percent.
Cost-Of-Living Adjustment (COLA): The BLS reported CPI-W increased to 234.170 in September, for a Q3 average of 234.242. In Q3 2013, CPI-W average 230.33. The annual Social Security Cost-Of-Living Adjustment will be 1.7%.
MBA: Mortgage Applications Increase in Latest MBA Weekly Survey
by Calculated Risk on 10/22/2014 07:00:00 AM
From the MBA: Mortgage Applications Increase in Latest MBA Weekly Survey
Mortgage applications increased 11.6 percent from one week earlier, according to data from the Mortgage Bankers Association’s (MBA) Weekly Mortgage Applications Survey for the week ending October 17, 2014. This week’s results did not include an adjustment for the Columbus Day holiday. ...
The Refinance Index increased 23 percent from the previous week to the highest level since November 2013. The seasonally adjusted Purchase Index decreased 5 percent from one week earlier....
...
“Continuing concerns about weak economic growth in Europe and a few US economic indicators that came in below expectations caused a flight to quality into US Treasuries last week, leading to sharp drops in interest rates,” said Mike Fratantoni, MBA’s Chief Economist. “Mortgage rates have fallen close to 30 basis points over the last four weeks. Refinance application volume reached the highest level since November 2013 as a result, and the average loan balance for refinance applications increased to $306,400, the highest level in the survey’s history.”
...
The average contract interest rate for 30-year fixed-rate mortgages with conforming loan balances ($417,000 or less) decreased to 4.10 percent, the lowest level since May 2013, from 4.20 percent, with points increasing to 0.21 from 0.17 (including the origination fee) for 80 percent loan-to-value ratio (LTV) loans.
emphasis added
 Click on graph for larger image.
The first graph shows the refinance index.
The refinance index is down 66% from the levels in May 2013.
Even with the recent increase in activity - as people who purchased in the last year or so refinance - refinance activity is very low this year and 2014 will be the lowest since year 2000.
 The second graph shows the MBA mortgage purchase index.
 According to the MBA, the unadjusted purchase index is down about 9% from a year ago.
Tuesday, October 21, 2014
Wednesday: Consumer Price Index
by Calculated Risk on 10/21/2014 08:42:00 PM
Here is a forecast for 2015 from the MBA: MBA Sees Originations Increasing Seven Percent in 2015
The Mortgage Bankers Association announced today that it expects to see $1.19 trillion in mortgage originations during 2015, a seven percent increase from 2014. While MBA anticipates purchase originations will increase 15 percent, it expects refinance originations to decrease three percent.Wednesday:
MBA’s forecast predicts purchase originations will increase to $731 billion in 2015, up from $635 billion in 2014. In contrast, refinances are expected to drop to $457 billion, from $471 billion, in 2014.
For 2016, MBA is forecasting purchase originations of $791 billion and refinance originations of $379 billion for a total of $1.17 trillion.
“We are projecting that home purchase originations will increase in 2015 as the US economy continues on its current path of stronger growth, job gains and declining unemployment. The job market has shown sustained improvement this year; with robust monthly increases in both payroll jobs and job openings,” said Michael Fratantoni, MBA’s Chief Economist and Senior Vice President for Research and Industry Technology. “We are forecasting that strong job growth, coupled with still low mortgage rates, should translate to an increase in home sales and purchase originations.
emphasis added
• At 7:00 AM ET, the Mortgage Bankers Association (MBA) will release the results for the mortgage purchase applications index.
• At 8:30 AM, the Consumer Price Index for September. The consensus is for no change in CPI in September and for core CPI to increase 0.1%.
NOTE: When CPI is released on Wednesday, the Cost-of-living adjustment for 2015 will be released. If CPI-W is unchanged in September, COLA will be around 1.7%.
• During the day, the AIA's Architecture Billings Index for September (a leading indicator for commercial real estate).
DataQuick: California Foreclosure Starts Lowest Since 2005
by Calculated Risk on 10/21/2014 05:42:00 PM
From DataQuick: Golden State Foreclosure Starts Continue to Decline
Lending institutions initiated formal foreclosure proceedings last quarter on the lowest number of California homes in more than eight years, the result of a recovering real estate market and the dwindling pool of toxic home loans made in 2006 and 2007, Irvine-based CoreLogic DataQuick reported.
A total of 16,833 Notices of Default (NoDs) were recorded at county recorders offices during the July-through-September period. That was down 3.9 percent from 17,524 for the prior quarter, and down 17.1 percent from 20,314 in third-quarter 2013, according to CoreLogic DataQuick data.
Last quarter's NoD tally was the lowest since fourth-quarter 2005, when 15,337 NoDs were recorded. NoDs peaked in first-quarter 2009 at 135,431, while the low was 12,417 NoDs in third-quarter 2004. The NoD statistics go back to 1992.
...
"This home repo pipeline isn't exactly drying up, but it sure is diminishing. Its negative effect on the overall market is only a fraction of what it was several years ago, and is really only still noticeable in some pockets of the hardest-hit markets of the Inland Empire and Central Valley," said John Karevoll, a CoreLogic DataQuick analyst.
To some extent the level of NoD filings in recent quarters probably reflects the rate at which servicers are able to process paperwork. The 20,314 NoDs filed in third-quarter 2013 were followed by 18,120 the following quarter and then 19,215 in 2014Q1; 17,524 in 2014Q2; and 16,833 last quarter.
Most of the loans going into default are still from the 2005-2007 period. Last quarter the median origination quarter for defaulted loans was third-quarter 2006. That has been the case for more than five years, indicating that weak underwriting standards peaked then.
emphasis added
 Click on graph for larger image.
This graph shows the number of Notices of Default (NoD) filed in California each year. 2014 is in red (estimate based on Q1, Q2 and Q3).
Last year was the lowest year for foreclosure starts since 2005, and 2013 was also below the levels in 1997 through 2000 when prices were rising following the much smaller late '80s housing bubble / early '90s bust in California.
Overall foreclosure starts are close to a normal level in California (foreclosure starts were over 50,000 in 2004 and 2005 when prices were rising quickly).
Note: Foreclosures are still higher than normal in states with a judicial foreclosure process.
LA area Port Traffic in September: Imports Highest since 2006, Exports Soft
by Calculated Risk on 10/21/2014 03:48:00 PM
Container traffic gives us an idea about the volume of goods being exported and imported - and possibly some hints about the trade report for September since LA area ports handle about 40% of the nation's container port traffic.
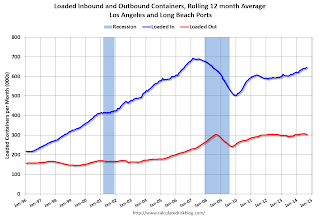
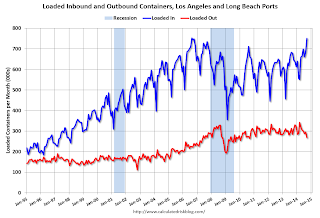
The following graphs are for inbound and outbound traffic at the ports of Los Angeles and Long Beach in TEUs (TEUs: 20-foot equivalent units or 20-foot-long cargo container).
To remove the strong seasonal component for inbound traffic, the first graph shows the rolling 12 month average.

On a rolling 12 month basis, inbound traffic was up 0.9% compared to the rolling 12 months ending in August. Outbound traffic was down 0.4% compared to 12 months ending in August.
Inbound traffic has been increasing, and outbound traffic has been mostly moving sideways.
The 2nd graph is the monthly data (with a strong seasonal pattern for imports).

Imports were up 10.6% year-over-year in September, exports were down 5.6% year-over-year.
This might suggest retailers are expecting a happy holiday season.


