by Calculated Risk on 7/24/2014 12:31:00 PM
Thursday, July 24, 2014
Comments on the New Home Sales report
The new home sales report for June - combined with the downward revisions for previous months - was very weak.
The Census Bureau reported that new home sales this year, through June, were 225,000, Not seasonally adjusted (NSA). That is down 4.3% from 235,000 during the first half of 2013 (NSA).
Maybe sales will move sideways for a little longer, but remember early 2013 was a difficult comparison period. Annual sales in 2013 were up 16.3% from 2012, but sales in the first four months of 2013 were up 26% from the same period in 2012!
 Click on graph for larger image.
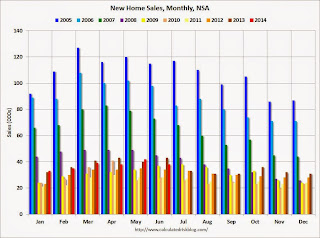
This graph shows new home sales for 2013 and 2014 by month (Seasonally Adjusted Annual Rate).
The comparisons to last year will be a little easier in Q3, and I still expect to see year-over-year growth later this year.
And here is another update to the "distressing gap" graph that I first started posting several years ago to show the emerging gap caused by distressed sales. Now I'm looking for the gap to close over the next few years.
 The "distressing gap" graph shows existing home sales (left axis) and new home sales (right axis) through June 2014. This graph starts in 1994, but the relationship has been fairly steady back to the '60s.
Following the housing bubble and bust, the "distressing gap" appeared mostly because of distressed sales.
I expect existing home sales to decline or move sideways (distressed sales will slowly decline and be partially offset by more conventional / equity sales). And I expect this gap to slowly close, mostly from an increase in new home sales.
Note: Existing home sales are counted when transactions are closed, and new home sales are counted when contracts are signed. So the timing of sales is different.
Kansas City Fed: Regional Manufacturing "Activity Edged Higher" in July
by Calculated Risk on 7/24/2014 11:00:00 AM
From the Kansas City Fed: Growth in Tenth District Manufacturing Activity Edged Higher
The Federal Reserve Bank of Kansas City released the July Manufacturing Survey today. According to Chad Wilkerson, vice president and economist at the Federal Reserve Bank of Kansas City, the survey revealed that growth in Tenth District manufacturing activity edged higher, and producers’ optimism for future activity increased.The last regional Fed manufacturing survey for July will be released on Monday, July 28th (the Dallas Fed). All of the regional surveys so far have indicated stronger growth in July than in June and - in general - the strongest growth in several years.
“Factories in our region reported slightly faster growth in July,” said Wilkerson. “In addition, future hiring and capital spending plans were the highest in six months.”
The month-over-month composite index was 9 in July, up from 6 in June but slightly lower than 10 in May. The composite index is an average of the production, new orders, employment, supplier delivery time, and raw materials inventory indexes. ... The production index climbed from 2 to 11, and the shipments, new orders [to 12], and employment indexes [from 1 to 8] also rose considerably.
emphasis added
New Home Sales decrease to 406,000 Annual Rate in June
by Calculated Risk on 7/24/2014 10:00:00 AM
The Census Bureau reports New Home Sales in June were at a seasonally adjusted annual rate (SAAR) of 406 thousand.
May sales were revised down from 504 thousand to 442 thousand, and April sales were revised down from 425 thousand to 408 thousand.
Sales of new single-family houses in June 2014 were at a seasonally adjusted annual rate of 406,000, according to estimates released jointly today by the U.S. Census Bureau and the Department of Housing and Urban Development. This is 8.1 percent below the revised May rate of 442,000 and is 11.5 percent below the June 2013 estimate of 459,000.
 Click on graph for larger image.
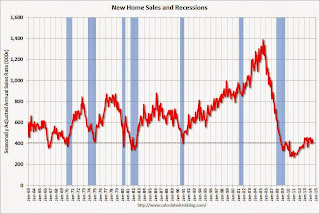
The first graph shows New Home Sales vs. recessions since 1963. The dashed line is the current sales rate.
Even with the increase in sales over the previous two years, new home sales are still close to the bottom for previous recessions.
The second graph shows New Home Months of Supply.
 The months of supply increased in June to 5.8 months from 5.2 months in May.
 The all time record was 12.1 months of supply in January 2009.
This is now in the normal range (less than 6 months supply is normal).
"The seasonally adjusted estimate of new houses for sale at the end of June was 197,000. This represents a supply of 5.8 months at the current sales rate."
 On inventory, according to the Census Bureau:
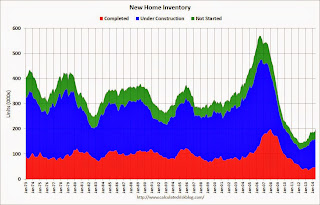
 "A house is considered for sale when a permit to build has been issued in permit-issuing places or work has begun on the footings or foundation in nonpermit areas and a sales contract has not been signed nor a deposit accepted."Starting in 1973 the Census Bureau broke this down into three categories: Not Started, Under Construction, and Completed.
The third graph shows the three categories of inventory starting in 1973.
The inventory of completed homes for sale is still low, and the combined total of completed and under construction is also low.
 The last graph shows sales NSA (monthly sales, not seasonally adjusted annual rate).
In June 2014 (red column), 38 thousand new homes were sold (NSA). Last year 43 thousand homes were also sold in June. The high for June was 115 thousand in 2005, and the low for June was 28 thousand in 2010 and 2011.
This was well below expectations of 475,000 sales in June, and sales were down 11.5% year-over-year.
I'll have more later today .
Weekly Initial Unemployment Claims decrease to 284,000, 4-Week Average Lowest since May 2007
by Calculated Risk on 7/24/2014 08:30:00 AM
The DOL reports:
In the week ending July 19, the advance figure for seasonally adjusted initial claims was 284,000, a decrease of 19,000 from the previous week's revised level. This is the lowest level for initial claims since February 18, 2006 when they were 283,000. The previous week's level was revised up by 1,000 from 302,000 to 303,000. The 4-week moving average was 302,000, a decrease of 7,250 from the previous week's revised average. This is the lowest level for this average since May 19, 2007 when it was 302,000. The previous week's average was revised up by 250 from 309,000 to 309,250.The previous week was revised up to 303,000.
There were no special factors impacting this week's initial claims.
The following graph shows the 4-week moving average of weekly claims since January 1971.
 Click on graph for larger image.
The dashed line on the graph is the current 4-week average. The four-week average of weekly unemployment claims decreased to 302,000.
This was lower than the consensus forecast of 310,000. The 4-week average is now at normal levels for an expansion.
Wednesday, July 23, 2014
Thursday: New Home Sales, Unemployment Claims and More
by Calculated Risk on 7/23/2014 08:16:00 PM
The scams never end, and this one was really disgusting (ripping off people in financial trouble) ... from the LA Times: Authorities crack down on mortgage-relief scams nationwide
Federal and state officials filed lawsuits accusing dozens of companies of ripping off struggling homeowners by falsely promising help in avoiding foreclosures or lowering mortgage payments while collecting millions of dollars in illegal upfront fees.Thursday:
...
The Consumer Financial Protection Bureau said three suits it filed against eight companies and their owners involved scams that cost homeowners more than $25 million in illegal upfront fees for services such as renegotiating mortgages or preventing foreclosures.
• At 8:30 AM ET, the initial weekly unemployment claims report will be released. The consensus is for claims to increase to 310 thousand from 302 thousand.
• At 10:00 AM, New Home Sales for June from the Census Bureau. The consensus is for a decrease in sales to 475 thousand Seasonally Adjusted Annual Rate (SAAR) in June from 504 thousand in May.
• At 11:00 AM, the Kansas City Fed manufacturing survey for July.
• During the day, the NMHC Quarterly Survey of Apartment Conditions.


