by Calculated Risk on 6/06/2014 08:30:00 AM
Friday, June 06, 2014
May Employment Report: 217,000 Jobs, 6.3% Unemployment Rate
From the BLS:
Total nonfarm payroll employment rose by 217,000 in May, and the unemployment rate was unchanged at 6.3 percent, the U.S. Bureau of Labor Statistics reported today.
...
After revision, the change in total nonfarm employment for March remained +203,000, and the change for April was revised from +288,000 to +282,000. With these revisions, employment gains in March and April were 6,000 lower than previously reported.
 Click on graph for larger image.
The headline number was at expectations of 213,000 payroll jobs added.
The first graph shows the job losses from the start of the employment recession, in percentage terms, compared to previous post WWII recessions. The dotted line is ex-Census hiring.
This shows the depth of the recent employment recession - worse than any other post-war recession - and the relatively slow recovery due to the lingering effects of the housing bust and financial crisis.

Total employment is now 98 thousand above the pre-recession peak and at an all time high. It is probably time to retire this graph - until the next recession.
NOTE: The second graph is the change in payroll jobs ex-Census - meaning the impact of the decennial Census temporary hires and layoffs is removed to show the underlying payroll changes.
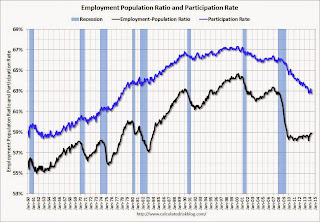
The third graph shows the employment population ratio and the participation rate.
 The Labor Force Participation Rate was unchanged in May at 62.8%. This is the percentage of the working age population in the labor force. A large portion of the recent decline in the participation rate is due to demographics.
The Employment-Population ratio was unchanged in May at 58.9% (black line).
I'll post the 25 to 54 age group employment-population ratio graph later.
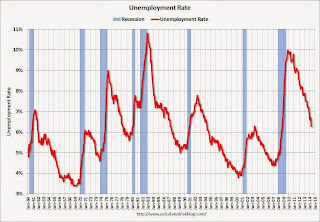
 The fourth graph shows the unemployment rate.
 The unemployment rate was unchanged in May at 6.3%.
This was a solid employment report, and total non-farm employment is now at a new all time high.
I'll have much more later ...
Thursday, June 05, 2014
Friday: Jobs, Jobs, Jobs
by Calculated Risk on 6/05/2014 09:47:00 PM
Some great graphs from Nick Timiraos at the WSJ: Mortgage Rates Are Falling, So Where Are the Home Buyers?
True, mortgage rates are low—as low as they’ve been in almost 12 months. But in the same way that shoppers may not be lured by “low prices” at a department store that is always advertising a sale, mortgage rates at 4.1% may not be seen as a steal by buyers who lived with rates that were even lower for all of 2012 and the first half of 2013—especially considering that prices have moved higher.Check out the graphs!
Friday:
• At 8:30 AM ET, the Employment Report for May. The consensus is for an increase of 213,000 non-farm payroll jobs in May, down from the 288,000 non-farm payroll jobs added in April. The consensus is for the unemployment rate to increase to 6.4% in May. There are 406 thousand more private sector jobs now than when the recession started in 2007, but total employment is still 113 thousand below the pre-recession peak.
• At 3:00 PM, Consumer Credit for April from the Federal Reserve. The consensus is for credit to increase $15.5 billion.
Mortgage Equity Withdrawal Still Negative in Q1 2014
by Calculated Risk on 6/05/2014 06:55:00 PM
Note: This is not Mortgage Equity Withdrawal (MEW) data from the Fed. The last MEW data from Fed economist Dr. Kennedy was for Q4 2008.
The following data is calculated from the Fed's Flow of Funds data (released this morning) and the BEA supplement data on single family structure investment. This is an aggregate number, and is a combination of homeowners extracting equity - hence the name "MEW", but there is little MEW right now - and normal principal payments and debt cancellation.
For Q1 2014, the Net Equity Extraction was minus $74 billion, or a negative 2.3% of Disposable Personal Income (DPI).
 Click on graph for larger image.
This graph shows the net equity extraction, or mortgage equity withdrawal (MEW), results, using the Flow of Funds (and BEA data) compared to the Kennedy-Greenspan method.
There are smaller seasonal swings right now, perhaps because there is a little actual MEW (this is heavily impacted by debt cancellation right now).
The Fed's Flow of Funds report showed that the amount of mortgage debt outstanding decreased by $37 billion in Q1. Compared to recent years, this was a small decrease in mortgage debt.
The Flow of Funds report also showed that Mortgage debt has declined by almost $1.3 trillion since the peak. This decline is mostly because of debt cancellation per foreclosures and short sales, and some from modifications. There has also been some reduction in mortgage debt as homeowners paid down their mortgages so they could refinance. With residential investment increasing, and a slower rate of debt cancellation, it is possible that MEW will turn positive again soon.
For reference:
Dr. James Kennedy also has a simple method for calculating equity extraction: "A Simple Method for Estimating Gross Equity Extracted from Housing Wealth". Here is a companion spread sheet (the above uses my simple method).
For those interested in the last Kennedy data included in the graph, the spreadsheet from the Fed is available here.
Employment Report Preview for May
by Calculated Risk on 6/05/2014 03:17:00 PM
Friday at 8:30 AM ET, the BLS will release the employment report for May. The consensus, according to Bloomberg, is for an increase of 213,000 non-farm payroll jobs in May (range of estimates between 110,000 and 240,000), and for the unemployment rate to increase to 6.4% (a slight bounce back following the sharp decline in April).
Note: The BLS reported 288,000 payroll jobs added in April with the unemployment rate at 6.3%.
Here is a summary of recent data:
• The ADP employment report showed an increase of 179,000 private sector payroll jobs in May. This was below expectations of 210,000 private sector payroll jobs added. The ADP report hasn't been very useful in predicting the BLS report for any one month, but in general, this suggests employment growth below expectations.
• The ISM manufacturing employment index decreased in May to 52.8%. A historical correlation between the ISM manufacturing employment index and the BLS employment report for manufacturing, suggests that private sector BLS manufacturing payroll jobs decreased about 5,000 in May. The ADP report indicated a 10,000 increase for manufacturing jobs in May.
The ISM non-manufacturing employment index increased in May to 52.4%. A historical correlation between the ISM non-manufacturing employment index and the BLS employment report for non-manufacturing, suggests that private sector BLS non-manufacturing payroll jobs increased about 135,000 in May.
Combined, the ISM surveys suggest about 130,000 payroll jobs added in May (note that the ISM diffusion indexes are based on number of firms, not employees - and the timing is different).
• Initial weekly unemployment claims averaged close to 310,000 in May, the lowest level since 2007. However for the BLS reference week (includes the 12th of the month), initial claims were at 327,000; this was up from 305,000 during the reference week in April.
The higher reference week reading suggests some downside to the consensus forecast.
• The final May Reuters / University of Michigan consumer sentiment index decreased to 81.9 from the March reading of 84.1. This is frequently coincident with changes in the labor market, but there are other factors too.
• On small business hiring: The small business index from Intuit showed a 35,000 increase in small business employment in May - the largest gain in more than a year. From Intuit:
"This month's employment increase is the largest we've seen in more than a year. In addition to the impressive increase of jobs this month, the hiring rate is also at the highest level we've seen since early 2009," said Susan Woodward, the economist who works with Intuit to create the indexes.And from NFIB: NFIB Jobs Statement: Employment Improves a Bit, Raises New Hopes?
“NFIB owners increased employment by an average of 0.11 workers per firm in May (seasonally adjusted), the eighth positive month in a row and the best string of gains since 2006. ... Job creation plans continued to strengthen ..."• Conclusion: Most of the data was on the downside with the exception of small business hiring. The ADP report was lower in May than in April, and below forecasts. Weekly unemployment claims were higher during the reference period, and the ISM indexes suggest lower hiring. However the Intuit small business index showed the most hiring in a year.
Also - any bounce back from the severe winter weather probably happened in March and April.
There is always some randomness to the employment report, but the I'll take the under on the consensus forecast of 213,000 nonfarm payrolls jobs added in May.
Final note: A key number will be 113,000 jobs added (including all revisions). This will put employment above the pre-recession peak.
Trulia: Asking House Prices up 8.0% year-over-year in May, "slowest rate in 13 months"
by Calculated Risk on 6/05/2014 01:31:00 PM
From Trulia chief economist Jed Kolko: Home Price Gains Finally More Balanced, Sustainable, and Widespread
Asking home prices rose at their slowest rate in 13 months, rising just 8.0% year-over-year (7.2% excluding foreclosures). Although this year-over-year increase is slower than in previous months, an 8.0% increase is still far above the long-term historical norm for home-price appreciation. Furthermore, prices continue to climb in the most recent quarter: the 2.4% quarter-over-quarter increase in May 2014 is equivalent to 9.9% on an annualized basis. Finally, price gains continue to be widespread, with 93 of the 100 largest metros clocking quarter-over-quarter price increases, seasonally adjusted.Here is the slowdown: In November 2013, year-over-year asking prices were up 12.2%. In December, the year-over-year increase slowed slightly to 11.9%. In January 11.4%, in February 10.4%, in March 10.0%, April 9.0% and now in May 8.0%.
Nationally, asking home prices are rising slower than in previous months, but the real change has been the price slowdown in the hyper-rebounding markets of the West. In May 2014, none of the 100 largest metros had a year-over-year price gain of more than 20%; the steepest increase was 18.8%, in Riverside-San Bernardino. Among the markets with the biggest price gains today, three – Las Vegas, Sacramento, and Oakland – have had significant slowdowns in year-over-year gains, from around 30% in May 2013 to around 15% in May 2014. In contrast, price gains accelerated dramatically in Chicago, up 13.5% year-over-year in May 2014 versus just 3.6% in May 2013. Overall, half of the top 10 markets with the largest price gains are outside the West, another big change from last year when almost all of the biggest price increases were in the West.
...
Rents are up 5.1% year-over-year nationally, with apartment rents up 5.8% and single-family rents up 2.1%.
emphasis added
This suggests prices are still increasing, but at a slower pace.
Note: These asking prices are SA (Seasonally Adjusted) - and adjusted for the mix of homes - and this suggests further house price increases, but at a slower rate, over the next few months on a seasonally adjusted basis.


