by Calculated Risk on 4/18/2014 03:24:00 PM
Friday, April 18, 2014
Existing Home Sales: Lawler vs. the Consensus
The NAR will report March Existing Home Sales on Tuesday, April 22nd. The consensus is for sales of 4.56 million on seasonally adjusted annual rate (SAAR) basis. Sales in February were at a 4.60 million SAAR. Economist Tom Lawler estimates the NAR will report sales of 4.64 million SAAR.
Housing economist Tom Lawler has been sending me his predictions of what the NAR will report for 4 years. The table below shows the consensus for each month, Lawler's predictions, and the NAR's initial reported level of sales.
Lawler hasn't always been closer than the consensus, but usually when there has been a fairly large spread between Lawler's estimate and the "consensus", Lawler has been closer.
Over the last four years, the consensus average miss was 160 thousand with a standard deviation of 170 thousand. Lawler's average miss was 70 thousand with a standard deviation of 50 thousand.
Note: Many analysts now change their "forecast" after Lawler's estimate is posted, so the consensus is doing a little better recently!
| Existing Home Sales, Forecasts and NAR Report millions, seasonally adjusted annual rate basis (SAAR) | |||
|---|---|---|---|
| Month | Consensus | Lawler | NAR reported1 |
| May-10 | 6.20 | 5.83 | 5.66 |
| Jun-10 | 5.30 | 5.30 | 5.37 |
| Jul-10 | 4.66 | 3.95 | 3.83 |
| Aug-10 | 4.10 | 4.10 | 4.13 |
| Sep-10 | 4.30 | 4.50 | 4.53 |
| Oct-10 | 4.50 | 4.46 | 4.43 |
| Nov-10 | 4.85 | 4.61 | 4.68 |
| Dec-10 | 4.90 | 5.13 | 5.28 |
| Jan-11 | 5.20 | 5.17 | 5.36 |
| Feb-11 | 5.15 | 5.00 | 4.88 |
| Mar-11 | 5.00 | 5.08 | 5.10 |
| Apr-11 | 5.20 | NA | 5.05 |
| May-11 | 4.75 | 4.80 | 4.81 |
| Jun-11 | 4.90 | 4.71 | 4.77 |
| Jul-11 | 4.92 | 4.69 | 4.67 |
| Aug-11 | 4.75 | 4.92 | 5.03 |
| Sep-11 | 4.93 | 4.83 | 4.91 |
| Oct-11 | 4.80 | 4.86 | 4.97 |
| Nov-11 | 5.08 | 4.40 | 4.42 |
| Dec-11 | 4.60 | 4.64 | 4.61 |
| Jan-12 | 4.69 | 4.66 | 4.57 |
| Feb-12 | 4.61 | 4.63 | 4.59 |
| Mar-12 | 4.62 | 4.59 | 4.48 |
| Apr-12 | 4.66 | 4.53 | 4.62 |
| May-12 | 4.57 | 4.66 | 4.55 |
| Jun-12 | 4.65 | 4.56 | 4.37 |
| Jul-12 | 4.50 | 4.47 | 4.47 |
| Aug-12 | 4.55 | 4.87 | 4.82 |
| Sep-12 | 4.75 | 4.70 | 4.75 |
| Oct-12 | 4.74 | 4.84 | 4.79 |
| Nov-12 | 4.90 | 5.10 | 5.04 |
| Dec-12 | 5.10 | 4.97 | 4.94 |
| Jan-13 | 4.90 | 4.94 | 4.92 |
| Feb-13 | 5.01 | 4.87 | 4.98 |
| Mar-13 | 5.03 | 4.89 | 4.92 |
| Apr-13 | 4.92 | 5.03 | 4.97 |
| May-13 | 5.00 | 5.20 | 5.18 |
| Jun-13 | 5.27 | 4.99 | 5.08 |
| Jul-13 | 5.13 | 5.33 | 5.39 |
| Aug-13 | 5.25 | 5.35 | 5.48 |
| Sep-13 | 5.30 | 5.26 | 5.29 |
| Oct-13 | 5.13 | 5.08 | 5.12 |
| Nov-13 | 5.02 | 4.98 | 4.90 |
| Dec-13 | 4.90 | 4.96 | 4.87 |
| Jan-14 | 4.70 | 4.67 | 4.62 |
| Feb-14 | 4.64 | 4.60 | 4.60 |
| Mar-14 | 4.56 | 4.64 | --- |
| 1NAR initially reported before revisions. | |||
The Sluggish Recovery for U.S. Heavy Truck Sales
by Calculated Risk on 4/18/2014 12:25:00 PM
Just a quick graph ... heavy truck sales really collapsed during the recession, falling to a low of 181 thousand in April 2009 on a seasonally adjusted annual rate (SAAR) from a peak of 555 thousand in February 2006.
Sales doubled from the recession low by April 2012 - and have mostly moved sideways since then.

Click on graph for larger image.
This graph shows heavy truck sales since 1967 using data from the BEA. The dashed line is current estimated sales rate.
As construction - both residential and commercial - picks up, heavy truck sales will probably increase further.
BLS: No State had 9% Unemployment Rate in March, First time since September 2008
by Calculated Risk on 4/18/2014 10:33:00 AM
From the BLS: Regional and State Employment and Unemployment Summary
Regional and state unemployment rates were generally little changed in March. Twenty-one states had unemployment rate decreases, 17 states and the District of Columbia had increases, and 12 states had no change, the U.S. Bureau of Labor Statistics reported today.
...
Rhode Island had the highest unemployment rate among the states in March, 8.7 percent. The next highest rates were in Nevada and Illinois, 8.5 percent and 8.4 percent, respectively. North Dakota again had the lowest jobless rate, 2.6 percent.
 Click on graph for larger image.
This graph shows the current unemployment rate for each state (red), and the max during the recession (blue). All states are well below the maximum unemployment rate for the recession.
The size of the blue bar indicates the amount of improvement.
The states are ranked by the highest current unemployment rate. No state has double digit or even a 9% unemployment rate.
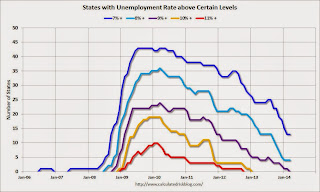
 The second graph shows the number of states with unemployment rates above certain levels since January 2006. At the worst of the employment recession, there were 10 states with an unemployment rate above 11% (red).
Currently no state has an unemployment rate at or above 9% (purple), four states are at or above 8% (light blue), and 13 states are at or above 7% (blue).
Thursday, April 17, 2014
Merrill Lynch Reduces Housing Forecast for 2014
by Calculated Risk on 4/17/2014 09:06:00 PM
From Michelle Meyer at Merrill Lynch: Will April showers bring May flowers?
We have all been waiting for the weather to unleash stronger economic activity, particularly for the housing market. However, the housing data so far have been less than encouraging. We think it will be challenging to realize average housing starts of 1.1 million this year and are therefore trimming our forecast to 1.03 million. Our trajectory through year end is still up, with starts rising 11% from last year, but the rebound is more muted. Slower growth in starts combined with the weaker pace of home sales suggests residential investment will add 0.2pp to GDP growth this year versus our prior forecast of 0.3pp.Merrill has reduced their forecast for housing starts from 1.100 million this year to 1.033 million (still an 11% increase from 2013). They have kept their forecast for new home sales at 515 thousand (close to a 20% gain).
...
It is important to put the recovery in housing construction into perspective. The turn started in early 2011 and gained momentum at the end of 2012. However, last year growth was weak until the bounce at the very end of the year. The question is whether that bounce was a start of a stronger rebound which just got delayed due to the weather or simply noise in the data. We think the truth is somewhere in between and are therefore penciling in an acceleration in starts, but not at the pace we experienced in Q4 of last year.
We have to remember that while this is not a V-shaped trajectory, it is still a recovery. Housing construction will head higher as household formation gradually recovers, capacity constraints around available lots and labor are resolved and credit conditions slowly ease for homebuyers. But this all takes time, and we must be patient as the market finds its new equilibrium.
LA area Port Traffic: Up year-over-year in March, Exports at New High
by Calculated Risk on 4/17/2014 05:59:00 PM
Container traffic gives us an idea about the volume of goods being exported and imported - and possibly some hints about the trade report for March since LA area ports handle about 40% of the nation's container port traffic.
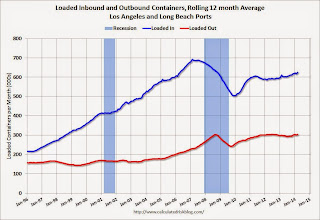
The following graphs are for inbound and outbound traffic at the ports of Los Angeles and Long Beach in TEUs (TEUs: 20-foot equivalent units or 20-foot-long cargo container).
To remove the strong seasonal component for inbound traffic, the first graph shows the rolling 12 month average.
 Click on graph for larger image.
On a rolling 12 month basis, inbound traffic was up 1.3% compared to the rolling 12 months ending in February. Outbound traffic was up 0.9% compared to 12 months ending in February.
Inbound traffic has generally been increasing, and outbound traffic has been moving up a little after moving sideways.
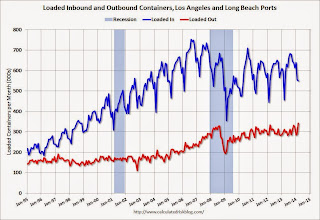
The 2nd graph is the monthly data (with a strong seasonal pattern for imports).
 Usually imports peak in the July to October period as retailers import goods for the Christmas holiday, and then decline sharply and bottom in February or March (depending on the timing of the Chinese New Year).
This suggests an increase in trade with Asia in March.


