by Calculated Risk on 2/21/2014 02:45:00 PM
Friday, February 21, 2014
Lawler: Updated Table of Distressed Sales and Cash buyers for Selected Cities in January
Economist Tom Lawler sent me the updated table below of short sales, foreclosures and cash buyers for several selected cities in January.
Lawler writes:
The short-sales share of home sales is down in virtually all markets, and in most markets by a lot from a year ago. Note that the foreclosure sales share in Florida is up from a year ago.From CR: Total "distressed" share is down significantly in most of these markets, mostly because of a decline in short sales.
And foreclosures are down in all areas except Florida.
The All Cash Share (last two columns) is mostly declining year-over-year. As investors pull back in markets the share of all cash buyers will probably decline.
In general it appears the housing market is slowly moving back to normal.
| Short Sales Share | Foreclosure Sales Share | Total "Distressed" Share | All Cash Share | |||||
|---|---|---|---|---|---|---|---|---|
| Jan-14 | Jan-13 | Jan-14 | Jan-13 | Jan-14 | Jan-13 | Jan-14 | Jan-13 | |
| Las Vegas | 17.0% | 36.2% | 11.0% | 12.5% | 28.0% | 48.7% | 46.3% | 56.1% |
| Reno** | 16.0% | 41.0% | 9.0% | 10.0% | 25.0% | 51.0% | ||
| Phoenix | 6.8% | 17.6% | 9.6% | 16.2% | 16.5% | 33.8% | 36.3% | 44.1% |
| Sacramento | 11.8% | 30.3% | 8.4% | 14.2% | 20.2% | 44.5% | 26.6% | 37.4% |
| Minneapolis | 5.4% | 10.3% | 24.0% | 31.9% | 29.4% | 42.2% | ||
| Mid-Atlantic | 8.5% | 13.1% | 12.2% | 12.7% | 20.7% | 25.8% | 22.9% | 22.0% |
| Orlando | 11.7% | 23.9% | 25.7% | 26.7% | 37.4% | 50.6% | 49.2% | 55.3% |
| California * | 11.5% | 23.9% | 7.7% | 19.0% | 19.2% | 42.9% | ||
| Bay Area CA* | 10.5% | 22.6% | 5.4% | 14.1% | 15.9% | 36.7% | 24.8% | 28.4% |
| So. California* | 12.2% | 24.2% | 6.6% | 17.2% | 18.8% | 41.4% | 29.1% | 33.7% |
| Florida SF | 9.5% | 19.4% | 24.2% | 19.9% | 33.7% | 39.3% | 49.1% | 50.5% |
| Florida C/TH | 7.6% | 14.8% | 19.6% | 17.2% | 27.2% | 32.0% | 72.3% | 74.4% |
| Miami MSA SF | 13.9% | 21.9% | 18.2% | 14.9% | 32.1% | 36.8% | 49.2% | 48.9% |
| Miami MSA C/TH | 10.3% | 16.4% | 20.1% | 16.4% | 30.4% | 32.8% | 75.2% | 77.8% |
| Northeast Florida | 45.0% | 46.3% | ||||||
| Chicago | 11.0% | NA | 31.0% | NA | 42.0% | 49.0% | ||
| Hampton Roads | 29.5% | 34.9% | ||||||
| Toledo | 43.9% | 44.4% | ||||||
| Des Moines | 22.2% | 26.8% | ||||||
| Peoria | 35.9% | 20.8% | ||||||
| Tucson | 38.2% | 36.7% | ||||||
| Omaha | 26.4% | 21.3% | ||||||
| Georgia*** | 35.7% | NA | ||||||
| Houston | 9.2% | 19.6% | ||||||
| Memphis* | 19.1% | 25.9% | ||||||
| Birmingham AL | 26.0% | 30.2% | ||||||
| *share of existing home sales, based on property records **Single Family Only ***GAMLS | ||||||||
Fannie Results, REO Inventory increases in Q4
by Calculated Risk on 2/21/2014 12:46:00 PM
From Fannie Mae: Fannie Mae Reports Comprehensive Income of $84.8 Billion for 2013 and $6.6 Billion for Fourth Quarter 2013
Fannie Mae reported annual net income for 2013 of $84.0 billion, which includes the release of the company’s valuation allowance against its deferred tax assets, and annual pre-tax income for 2013 of $38.6 billion.Here are some summary stats on Fannie’s single family REO activity.
Fannie Mae will pay Treasury $7.2 billion in dividends in March 2014. With the March dividend payment, Fannie Mae will have paid a total of $121.1 billion in dividends to Treasury in comparison to $116.1 billion in draw requests since 2008. Dividend payments do not offset prior Treasury draws.
...
While Fannie Mae expects to be profitable for the foreseeable future, the company does not expect to repeat its 2013 financial results, as those results were positively affected by the release of the company’s valuation allowance against its deferred tax assets, a significant increase in home prices during the year, and the large number of resolutions the company reached relating to representation and warranty matters and servicing matters.
emphasis added
| Fannie SF REO Activity | |||
|---|---|---|---|
| Acquisitions | Dispositions | Inventory | |
| Q3/09 | 40,959 | 31,299 | 72,275 |
| Q4/09 | 47,189 | 33,309 | 86,155 |
| Q1/10 | 61,929 | 38,095 | 109,989 |
| Q2/10 | 68,838 | 49,517 | 129,310 |
| Q3/10 | 85,349 | 47,872 | 166,787 |
| Q4/10 | 45,962 | 50,260 | 162,489 |
| Q1/11 | 53,549 | 62,814 | 153,224 |
| Q2/11 | 53,697 | 71,202 | 135,719 |
| Q3/11 | 45,194 | 58,297 | 122,616 |
| Q4/11 | 47,256 | 51,344 | 118,528 |
| Q1/12 | 47,700 | 52,071 | 114,157 |
| Q2/12 | 43,783 | 48,674 | 109,266 |
| Q3/12 | 41,884 | 43,925 | 107,225 |
| Q4/12 | 41,112 | 42,671 | 105,666 |
| Q1/13 | 38,717 | 42,934 | 101,449 |
| Q2/13 | 36,106 | 40,635 | 96,920 |
| Q3/13 | 37,353 | 33,332 | 100,941 |
| Q4/13 | 32,208 | 29,920 | 103,229 |
 Click on graph for larger image.
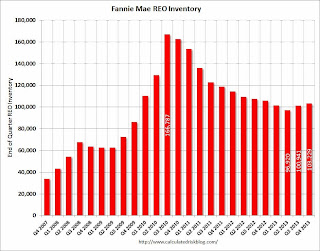
Here is a graph of Fannie REO. This was the second consecutive quarterly increase in REO.
Fannie’s SF REO inventory increased in Q4 mostly because of a decline in REO dispositions. Fannie reported the decline in acquisitions was related to long time lines in certain states (judicial foreclosure process). It is unclear why there was a sharp decline in dispositions over the last two quarters.
Existing Home Sales in January: 4.62 million SAAR, Inventory up 7.3% Year-over-year
by Calculated Risk on 2/21/2014 10:00:00 AM
The NAR reports: Existing-Home Sales Drop in January While Prices Continue to Grow
Total existing-home sales, which are completed transactions that include single-family homes, townhomes, condominiums and co-ops, dropped 5.1 percent to a seasonally adjusted annual rate of 4.62 million in January from 4.87 million in December, and are also 5.1 percent below the 4.87 million-unit pace in January 2013. Last month’s level of activity was the slowest since July 2012, when it stood at 4.59 million.
...
Total housing inventory at the end of January rose 2.2 percent to 1.90 million existing homes available for sale, which represents a 4.9-month supply at the current sales pace, up from 4.6 months in December. Unsold inventory is 7.3 percent above a year ago, when there was a 4.4-month supply.
 Click on graph for larger image.
This graph shows existing home sales, on a Seasonally Adjusted Annual Rate (SAAR) basis since 1993.
Sales in January (4.62 million SAAR) were 5.1% lower than last month, and were 5.1% below the January 2013 rate.
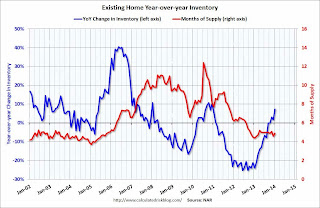
The second graph shows nationwide inventory for existing homes.
 According to the NAR, inventory increased to 1.90 million in January from 1.86 million in December. Inventory is not seasonally adjusted, and inventory usually increases from the seasonal lows in December and January, and peaks in mid-to-late summer.
The third graph shows the year-over-year (YoY) change in reported existing home inventory and months-of-supply. Since inventory is not seasonally adjusted, it really helps to look at the YoY change. Note: Months-of-supply is based on the seasonally adjusted sales and not seasonally adjusted inventory.
 Inventory increased 7.3% year-over-year in January compared to January 2013. This year-over-year increase in inventory suggests inventory bottomed earlier last year.
Months of supply was at 4.9 months in January.
This was slightly below expectations of sales of 4.70 million. For existing home sales, the key number is inventory - and the key story is inventory is still low, but up year-over-year. I'll have more later ...
Thursday, February 20, 2014
Friday: Existing Home Sales
by Calculated Risk on 2/20/2014 07:53:00 PM
First, here is a minor indicator that I follow, from ATA: Winter Weather Pushed ATA Truck Tonnage Index Down 4.3% in January
The American Trucking Associations’ advanced seasonally adjusted For-Hire Truck Tonnage Index decreased 4.3% in January, after edging 0.8% lower in December. In January, the index equaled 124.4 (2000=100) versus 130.0 in December. The all-time high was in November 2013 (131.0). Compared with January 2013, the SA index increased 1.2%.
...
“Like most economic indicators, truck tonnage was negatively impacted by bad winter weather in January,” said ATA Chief Economist Bob Costello. “The thing about truck freight is that it’s difficult to catch up. Drivers are governed by hours-of-service regulations and trucks are limited to trailer lengths and total weights, thus it is nearly impossible to recoup the days lost due to bad storms.”
As a result, Costello said January will be a tough month to gauge.
“January wasn’t just one storm, it was several across a large part of the country. Therefore, I wouldn’t panic from the largest monthly drop in two years," Costello said. "I’ve heard from many fleets that freight was good, in-between storms. The fundamentals for truck freight still look good.”
emphasis added
 Click on graph for larger image.
Here is a long term graph that shows ATA's For-Hire Truck Tonnage index.
The dashed line is the current level of the index.
The index is up 1.2% year-over-year.
Friday:
• At 10:00 AM ET, Existing Home Sales for January from the National Association of Realtors (NAR). The consensus is for sales of 4.70 million on seasonally adjusted annual rate (SAAR) basis. Sales in December were at a 4.87 million SAAR. Economist Tom Lawler estimates the NAR will report sales of 4.67 million SAAR.
MBA National Delinquency Survey: Judicial vs. Non-Judicial Foreclosure States in Q4 2013
by Calculated Risk on 2/20/2014 02:59:00 PM
Earlier I posted the MBA National Delinquency Survey press release and a graph that showed mortgage delinquencies and foreclosures by period past due. There is a clear downward trend for mortgage delinquencies, however some states are further along than others. From the press release:
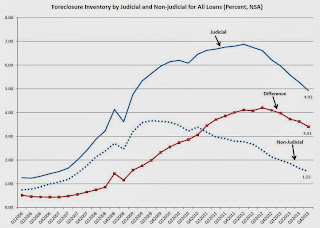
States with judicial foreclosure systems still account for most of the loans in foreclosure. Of the 17 states that had a higher foreclosure inventory rate than the national average, 15 were judicial states. While the percentage of loans in foreclosure dropped in both judicial and nonjudicial states, the average rate for judicial states was 4.92 percent compared to the average rate of 1.52 percent for nonjudicial states. That being said, for judicial states this was still a significant improvement from the rate of 6.88 percent recorded in 2012.
 Click on graph for larger image.
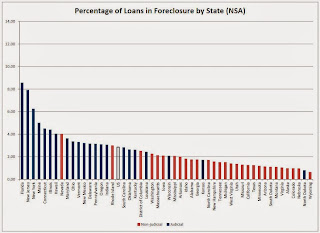
This graph is from the MBA and shows the percent of loans in the foreclosure process by state. Posted with permission. Blue is for judicial foreclosure states, and red for non-judicial foreclosure states.
The top states are Florida (8.56% in foreclosure down from 9.48% in Q3), New Jersey (7.90% down from 8.28%), New York (6.24% down from 6.34%), and Maine (5.00% down from 5.44%). Nevada is the only non-judicial state in the top 10, and this is partially due to state laws that slow foreclosures.
California (1.25% down from 1.42%) and Arizona (1.12% down from 1.26%) are now far below the national average by every measure.
 For judicial foreclosure states, foreclosure inventory peaked in Q2 2012 (foreclosure inventory is the number of mortgages in the foreclosure process). Foreclosure inventory in the judicial states has declined for six consecutive quarters. This was three years after the peak in foreclosure inventories for non-judicial states.
It looks like the judicial states will have a significant number of distressed sales for a few more years - however the non-judicial states are closer to normal levels.
Key Measures Shows Low Inflation in January
by Calculated Risk on 2/20/2014 12:30:00 PM
The Cleveland Fed released the median CPI and the trimmed-mean CPI this morning:
According to the Federal Reserve Bank of Cleveland, the median Consumer Price Index rose 0.2% (2.2% annualized rate) in January. The 16% trimmed-mean Consumer Price Index increased 0.1% (1.5% annualized rate) during the month. The median CPI and 16% trimmed-mean CPI are measures of core inflation calculated by the Federal Reserve Bank of Cleveland based on data released in the Bureau of Labor Statistics' (BLS) monthly CPI report.Note: The Cleveland Fed has the median CPI details for January here. The price for fuel oil and other fuels increased sharply in January, but prices for motor fuels declined.
Earlier today, the BLS reported that the seasonally adjusted CPI for all urban consumers rose 0.1% (1.7% annualized rate) in January. The CPI less food and energy increased 0.1% (1.5% annualized rate) on a seasonally adjusted basis.
 Click on graph for larger image.
This graph shows the year-over-year change for these four key measures of inflation. On a year-over-year basis, the median CPI rose 2.0%, the trimmed-mean CPI rose 1.6%, and the CPI less food and energy rose 1.6%. Core PCE is for December and increased just 1.2% year-over-year.
On a monthly basis, median CPI was at 2.2% annualized, trimmed-mean CPI was at 1.5% annualized, and core CPI increased 1.5% annualized.
These measures suggest inflation remains below the Fed's target.
MBA: Mortgage "Delinquency and Foreclosure Rates Decline to Lowest Level in Six Years" in Q4
by Calculated Risk on 2/20/2014 10:38:00 AM
From the MBA: Delinquency and Foreclosure Rates Decline to Lowest Level in Six Years
The delinquency rate for mortgage loans on one-to-four-unit residential properties decreased to a seasonally adjusted rate of 6.39 percent of all loans outstanding at the end of the fourth quarter of 2013, the lowest level since the first quarter of 2008. The delinquency rate decreased two basis points from the previous quarter, and 70 basis points from one year ago, according to the Mortgage Bankers Association’s (MBA) National Delinquency Survey.
The delinquency rate includes loans that are at least one payment past due but does not include loans in the process of foreclosure. The percentage of loans in the foreclosure process at the end of the fourth quarter was 2.86 percent, down 22 basis points from the third quarter and 88 basis points lower than one year ago. This was the lowest foreclosure inventory rate seen since 2008.
...
“We continue to see substantial improvement in both delinquency and foreclosure rates, with most measures now back to pre-crisis levels,” said Michael Fratantoni, MBA’s Chief Economist and Senior Vice President of Research and Industry Technology. “The delinquency rate, at 6.39 percent, is more than 3 percentage points lower than its peak of over 10 percent in 2010 and is edging closer to the historical average of around 5 percent. The percentage of loans in foreclosure has fallen for the seventh consecutive quarter, decreasing to 2.86 percent, the lowest level in six years. The percentage of new foreclosures started, at 0.54 percent, is the lowest in eight years and is back within its typical historical range.
“There was broad improvement in foreclosure rates in the fourth quarter, with 49 states and the District of Columbia recording a decrease. Florida still leads the nation in the percentage of loans in foreclosure, but that percentage has fallen to 8.56 percent from a peak of 14.5 percent. New Jersey and New York had the next two highest rates but both states did see a drop from the previous quarter. States with judicial foreclosure systems still account for most of the loans in foreclosure. Of the 17 states that had a higher foreclosure inventory rate than the national average, 15 were judicial states. While the percentage of loans in foreclosure dropped in both judicial and nonjudicial states, the average rate for judicial states was 4.92 percent compared to the average rate of 1.52 percent for nonjudicial states. That being said, for judicial states this was still a significant improvement from the rate of 6.88 percent recorded in 2012."
emphasis added
 Click on graph for larger image.
This graph shows the percent of loans delinquent by days past due.
Loans 30 days delinquent increased to 2.89% from 2.79% in Q3. This is close to the long term average.
Delinquent loans in the 60 day bucket decreased to 1.06% in Q4, from 1.07% in Q3. This is still slightly elevated.
The 90 day bucket decreased to 2.45% from 2.56%. This is still way above normal (around 0.8% would be normal according to the MBA).
The percent of loans in the foreclosure process decreased to 2.86% from 3.08% and is now at the lowest level since 2008.
Most of the poor performing loans were originated in 2007 or earlier, from the MBA's Fratantoni:
“Loan cohorts from 2009 and earlier continue to make up more than 90 percent of seriously delinquent loans. Loans originated in 2007 and earlier accounted for 75 percent of the seriously delinquent loans, while loans originated in 2008 and 2009 accounted for another 16 percent."This survey has shown steady improvement in delinquency and foreclosure rates, but it will take a few more years to work through the backlog - especially in judicial foreclosure states.
Philly Fed Manufacturing Survey indicates Contraction in February
by Calculated Risk on 2/20/2014 10:00:00 AM
From the Philly Fed: February Manufacturing Survey
The survey’s broadest measure of manufacturing conditions, the diffusion index of current activity, decreased from a reading of 9.4 in January to ‐6.3 this month. This was the first negative reading of the index in nine months.This was well below the consensus forecast of a reading of 10.0 for February.
...
The current employment index remained positive for the eighth consecutive month but declined 5 points from January.
emphasis added
Also Market released their Flash PMI for February this morning that suggests faster manufacturing expansion:
February data suggested a solid rebound in U.S. manufacturing business conditions following the slowdown recorded during the previous month. This was highlighted by a rise in the Markit Flash U.S. Manufacturing Purchasing Managers’ Index™ (PMI™), which is based on approximately 85% of usual monthly replies, from 53.7 in January to 56.7 in February. The latest reading pointed to the fastest overall improvement in U.S. manufacturing business conditions since May 2010.
Commenting on the flash PMI data, Chris Williamson, Chief Economist at Markit said:
“The flash manufacturing PMI provides the first indications that production has rebounded from the weather - related slowdown seen in January . Having slumped to a three - month low in January the PMI surged to its highest for almost four years in February, as companies reported business returning to normal after freezing temperatures and snow disrupted operations and supply chains.
“Hiring also picked up to the fastest since last March, with the survey signalling approximately 15,000 jobs being created in February.
“While the strong PMI reading in part represents a rebound from the temporary weakness seen at the start of the year, further growth looks likely in coming months, suggesting the underlying health of the economy remain s robust. In particular, February saw the largest rise in backlogs of work seen since prior to the financial crisis, as well as a further steep fall in inventories of finished goods. Both point to ongoing growth of production and hiring in March.”
emphasis added
Weekly Initial Unemployment Claims decrease to 336,000
by Calculated Risk on 2/20/2014 08:33:00 AM
The DOL reports:
In the week ending February 15, the advance figure for seasonally adjusted initial claims was 336,000, a decrease of 3,000 from the previous week's unrevised figure of 339,000. The 4-week moving average was 338,500, an increase of 1,750 from the previous week's unrevised average of 336,750.The previous week was unrevised.
The following graph shows the 4-week moving average of weekly claims since January 2000.
 Click on graph for larger image.
The dashed line on the graph is the current 4-week average. The four-week average of weekly unemployment claims increased to 338,500.
This was close to the consensus forecast of 335,000. Mostly moving sideways ...
Wednesday, February 19, 2014
Thursday: Unemployment Claims, CPI, Philly Fed Mfg Survey
by Calculated Risk on 2/19/2014 08:24:00 PM
First an update on Sacramento: Several years ago I started following the Sacramento market to look for changes in the mix of houses sold (conventional, REOs, and short sales). For a long time, not much changed. But over the last 2 years we've seen some significant changes with a dramatic shift from foreclosures (REO: lender Real Estate Owned) to short sales, and the percentage of total distressed sales declining sharply.
This data suggests healing in the Sacramento market, although some of this is due to investor buying. Other distressed markets are showing similar improvement. Note: The Sacramento Association of REALTORS® started breaking out REOs in May 2008, and short sales in June 2009.
In January 2014, 19.5% of all resales (single family homes) were distressed sales. This was up from 18.8% last month, and down from 44.5% in January 2013.
The percentage of REOs was at 8.1%, and the percentage of short sales decreased to 11.5%. The increase in December and January was seasonal (happens at the end of every year).
Here are the statistics.
 Click on graph for larger image.
This graph shows the percent of REO sales, short sales and conventional sales.
There has been a sharp increase in conventional sales recently (blue).
Active Listing Inventory for single family homes increased 96.3% year-over-year in January.
Cash buyers accounted for 26.6% of all sales, down from 37.4% a year ago (frequently investors). This has been trending down, and it appears investors are becoming less of a factor in Sacramento.
Total sales were down 24% from January 2013, but equity sales (non-distressed) were up compared to the same month last year. This is exactly what we expect to see in an improving distressed market - flat or even declining overall sales as distressed sales decline, and conventional sales increasing.
As I've noted before, we are seeing a similar pattern in other distressed areas. This suggests what will happen in other areas: 1) Flat or declining overall existing home sales, 2) but increasing conventional (equity) sales, 3) Less investor buying, 4) more inventory, and 5) slower price increases.
Thursday:
• At 8:30 AM ET, the initial weekly unemployment claims report will be released. The consensus is for claims to decrease to 335 thousand from 339 thousand.
• Also at 8:30 AM, the Consumer Price Index for January. The consensus is for a 0.1% increase in CPI in January and for core CPI to increase 0.1%.
• At 10:00 AM, the Philly Fed manufacturing survey for February. The consensus is for a reading of 10.0, up from 9.4 last month (above zero indicates expansion).


