by Calculated Risk on 9/04/2012 02:55:00 PM
Tuesday, September 04, 2012
U.S. Light Vehicle Sales at 14.5 million annual rate in August
Based on an estimate from Autodata Corp, light vehicle sales were at a 14.52 million SAAR in August. That is up 17% from August 2011, and up 3% from the sales rate last month.
This was above the consensus forecast of 14.3 million SAAR (seasonally adjusted annual rate).
This graph shows the historical light vehicle sales from the BEA (blue) and an estimate for August (red, light vehicle sales of 14.52 million SAAR from Autodata Corp).
 Click on graph for larger image.
The year-over-year increase was fairly large because the auto industry was still recovering from the impact of the tsunami and related supply chain issues in 2011 (the issues were mostly over in September of 2011).
Sales have averaged a 14.17 million annual sales rate through the first seven months of 2012, up from 12.4 million rate for the same period of 2011.
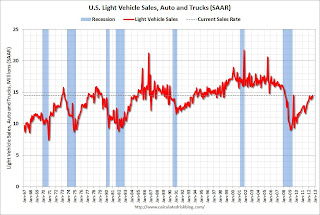
The second graph shows light vehicle sales since the BEA started keeping data in 1967.
 Note: dashed line is current estimated sales rate.
This shows the huge collapse in sales in the 2007 recession.
It looks like auto sales will be up slightly in Q3 compared to Q2, and make another small positive contribution to GDP.
Housing: Inventory down 23% year-over-year in early September
by Calculated Risk on 9/04/2012 01:55:00 PM
Note: I'll post an estimate for August auto sales around 4 PM ET.
Here is another update using inventory numbers from HousingTracker / DeptofNumbers to track changes in listed inventory. Tom Lawler mentioned this last year.
According to the deptofnumbers.com for (54 metro areas), inventory is off 22.6% compared to the same week last year. Unfortunately the deptofnumbers only started tracking inventory in April 2006.
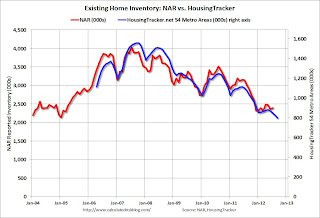
This graph shows the NAR estimate of existing home inventory through July (left axis) and the HousingTracker data for the 54 metro areas through early September.
 Click on graph for larger image.
Since the NAR released their revisions for sales and inventory last year, the NAR and HousingTracker inventory numbers have tracked pretty well.
On a seasonal basis, housing inventory usually bottoms in December and January and then increases through the summer. Inventory only increased a little this spring and has been declining for the last four months by this measure. It looks like inventory has peaked for this year.
The second graph shows the year-over-year change in inventory for both the NAR and HousingTracker.
 HousingTracker reported that the early September listings, for the 54 metro areas, declined 22.6% from the same period last year.
This decline in active inventory remains a huge story, and the lower level of inventory is pushing up house prices.
Construction Spending decreased in July
by Calculated Risk on 9/04/2012 11:40:00 AM
Catching up ... This morning the Census Bureau reported that overall construction spending decreased in July:
The U.S. Census Bureau of the Department of Commerce announced today that construction spending during July 2012 was estimated at a seasonally adjusted annual rate of $834.4 billion, 0.9 percent below the revised June estimate of $842.2 billion. The July figure is 9.3 percent above the July 2011 estimate of $763.5 billion.Both private construction spending and public spending declined:
Spending on private construction was at a seasonally adjusted annual rate of $558.7 billion, 1.2 percent below the revised June estimate of $565.6 billion. ... In July, the estimated seasonally adjusted annual rate of public construction spending was $275.7 billion, 0.4 percent below the revised June estimate of $276.7 billion.
 Click on graph for larger image.
This graph shows private residential and nonresidential construction spending, and public spending, since 1993. Note: nominal dollars, not inflation adjusted.
Private residential spending is 61% below the peak in early 2006, and up 19% from the recent low. Non-residential spending is 29% below the peak in January 2008, and up about 30% from the recent low.
Public construction spending is now 15% below the peak in March 2009 and near the post-bubble low.
 The second graph shows the year-over-year change in construction spending.
On a year-over-year basis, private residential construction spending is now up 19%. Non-residential spending is also up year-over-year mostly due to energy spending (power and electric). Public spending is still down year-over-year, although it now appears public construction spending is moving sideways.
The slight decline in residential construction spending in July followed several months of solid gains. The solid year-over-year increase in private residential investment is a positive for the economy (the increase in 2010 was related to the tax credit).
ISM Manufacturing index decreases slightly in August to 49.6
by Calculated Risk on 9/04/2012 10:00:00 AM
This is the third consecutive month of contraction (below 50) in the ISM index since the recession ended in 2009. PMI was at 49.6% in August, down slightly from 49.8% in July. The employment index was at 51.6%, down from 52.0%, and the new orders index was at 47.1%, down from 48.0%.
From the Institute for Supply Management: August 2012 Manufacturing ISM Report On Business®
The report was issued today by Bradley J. Holcomb, CPSM, CPSD, chair of the Institute for Supply Management™ Manufacturing Business Survey Committee. "The PMI™ registered 49.6 percent, a decrease of 0.2 percentage point from July's reading of 49.8 percent, indicating contraction in the manufacturing sector for the third consecutive month. This is also the lowest reading for the PMI™ since July 2009. The New Orders Index registered 47.1 percent, a decrease of 0.9 percentage point from July, indicating contraction in new orders for the third consecutive month. The Production Index registered 47.2 percent, a decrease of 4.1 percentage points and indicating contraction in production for the first time since May 2009. The Employment Index remained in growth territory at 51.6 percent, but registered its lowest reading since November 2009 when the Employment Index registered 51 percent. The Prices Index increased 14.5 percentage points from its July reading to 54 percent. Comments from the panel generally reflect a slowdown in orders and demand, with continuing concern over the uncertain state of global economies."
 Click on graph for larger image.
Here is a long term graph of the ISM manufacturing index.
This was below expectations of 50.0%. This suggests manufacturing contracted in August for the third consecutive month.
This was another weak report.
CoreLogic: House Price Index increases in July, Up 3.8% Year-over-year
by Calculated Risk on 9/04/2012 08:54:00 AM
Notes: This CoreLogic House Price Index report is for July. The Case-Shiller index released last week was for June. Case-Shiller is currently the most followed house price index, however CoreLogic is used by the Federal Reserve and is followed by many analysts. The CoreLogic HPI is a three month weighted average and is not seasonally adjusted (NSA).
From CoreLogic: CoreLogic® July Home Price Index Rises 3.8 Percent Year-Over-Year—Biggest Increase Since 2006
Home prices nationwide, including distressed sales, increased on a year-over-year basis by 3.8 percent in July 2012 compared to July 2011. This was the biggest year-over-year increase since August 2006. On a month-over-month basis, including distressed sales, home prices increased by 1.3 percent in July 2012 compared to June 2012. The July 2012 figures mark the fifth consecutive increase in home prices nationally on both a year-over-year and month-over-month basis.
Excluding distressed sales, home prices nationwide increased on a year-over-year basis by 4.3 percent in July 2012 compared to July 2011. On a month-over-month basis excluding distressed sales, home prices increased 1.7 percent in July 2012 compared to June 2012, also the fifth consecutive month-over-month increase. Distressed sales include short sales and real estate owned (REO) transactions.
The CoreLogic Pending HPI indicates that August home prices, including distressed sales, will rise by 4.6 percent on a year-over-year basis from August 2011 and at least 0.6 percent on a month-over-month basis from July 2012.
“The housing market continues its positive trajectory with significant price gains in July and our expectation of a further increase in August,” said Mark Fleming, chief economist for CoreLogic. “While the pace of growth is moderating as we transition to the off-season for home buying, we expect a positive gain in price levels for the full year.”
 Click on graph for larger image.
 This graph shows the national CoreLogic HPI data since 1976. January 2000 = 100.
The index was up 1.3% in July, and is up 3.8% over the last year.
The index is off 27% from the peak - and is up 9.7% from the post-bubble low set in February (the index is NSA, so some of the increase is seasonal).
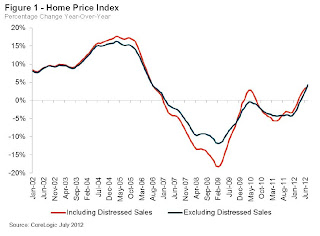
 The second graph is from CoreLogic. The year-over-year comparison has been positive for five consecutive months.
Excluding the tax credit bump, these are the first year-over-year increases since 2006 - and this is the largest year-over-year increase since 2006.


