 RSS Feed
 by Calculated Risk on 12/25/2011 09:31:00 AM
Sunday, December 25, 2011
Happy Holidays!
Happy Holidays and Merry Christmas to all!
• A better job market would be a great present for 2012. Although hiring will probably remain sluggish, there is a little good news ... from Greg Robb at MarketWatch: Jobless Claims becoming tought to ignore
While it is a bit of a stretch to say that economists are snug in their beds with visions of jobless claims dancing in their heads, there is no denying that they are growing more excited about the improvement in claims over the past month and will be focusing on that release in the holiday-shortened week.• And a little gift ... a common question, using excel, is how do you get from this:
“People are going to be focusing pretty heavily on claims,” said Josh Shapiro, chief U.S. economist at MFR Inc.
Claims have fallen by 40,000 over the past four weeks to a post-recession low of 364,000. After initial doubts when the decline started, many analysts are putting more weight on the down trend.
Yesterday:
• Schedule for Week of Dec 25th
• Summary for Week ending Dec 23rd
Thanks to all. Happy Holidays!
Saturday, December 24, 2011
Interview with Stand Up economist Yoram Bauman
by Calculated Risk on 12/24/2011 07:08:00 PM
Earlier:
• Schedule for Week of Dec 25th
• Summary for Week ending Dec 23rd
Bauman discusses a number of topics. He has spent the last 5 months in China - see his earlier video here on the Chinese housing bubble - and he doesn't think the Chinese economy is "not slowing down".
Some humor (the knock knock joke at the end is pretty funny - especially the goof by the interviewer).
Schedule for Week of Dec 25th
by Calculated Risk on 12/24/2011 02:07:00 PM
Earlier:
• Summary for Week ending Dec 23rd
Happy Holidays! This will be a light week for U.S. economic data. The Case-Shiller house price index will be released on Tuesday. Also the December Chicago PMI and three more regional Fed manufacturing surveys will released this week.
All US markets will be closed in observance of the Christmas Day holiday.
 9:00 AM: S&P/Case-Shiller House Price Index for October. Although this is the October report, it is really a 3 month average of August, September and October.
 This graph shows the nominal seasonally adjusted Composite 10 and Composite 20 indexes (the Composite 20 was started in January 2000).
The consensus is for a 0.2% decrease in prices in October. The CoreLogic index showed a 1.3% decrease in October (NSA). I expect new post-bubble lows for the Case-Shiller indexes (seasonally adjusted).
10:00 AM: Conference Board's consumer confidence index for December. The consensus is for an increase to 58.1 from 56.0 last month.
10:00 AM: Richmond Fed Survey of Manufacturing Activity for December. The consensus is for the index to be at 5, up from 0 in November (above zero is expansion).
10:30 AM: Dallas Fed Manufacturing Survey for December. The index showed contraction in November with a reading of -5.1 (the only regional survey showing contraction).
7:00 AM: The Mortgage Bankers Association (MBA) will release the mortgage purchase applications index. This index has been especially weak all year, although this doesn't include cash buyers.
8:30 AM: The initial weekly unemployment claims report will be released. Last week was the lowest level for the 4-week average of weekly claims since early 2008.
9:45 AM: Chicago Purchasing Managers Index for December. The consensus is for a decrease to 60.1 from 62.6 in November.
10:00 AM: Pending Home Sales Index for November. The consensus is for a 1.5% increase in the index.
11:00 AM: Kansas City Fed regional Manufacturing Survey for December. The consensus is for the index to be at 6, up from 4 in November (above zero is expansion).
No releases scheduled.
Summary for Week Ending December 23rd
by Calculated Risk on 12/24/2011 08:51:00 AM
This was another week with mostly improving U.S. economic data. Housing starts increased - mostly due to multi-family starts, and new home sales ticked up slightly (still mostly moving sideways).
Existing home sales were revised down sharply, but the good news is listed inventory has fallen to 2005 levels. Of course there is still a large "shadow inventory", and there are many more homeowners waiting for a better market - but the decline in listed inventory is a positive.
Also builder confidence increased slightly (still depressed), the Architecture Billings Index increased (and is indicating expansion again), consumer sentiment has rebounded from the recent lows, and initial weekly unemployment claims are at the lowest level since early 2008.
Personal income and spending was sluggish in November, but most of the data showed a little improvement.
Here is a summary of last week in graphs:
• Housing Starts increased in November
 Click on graph for larger image.
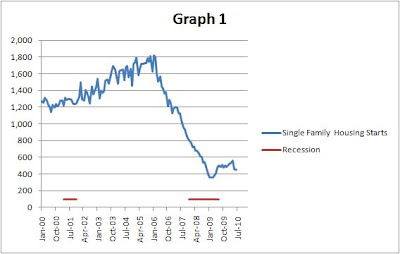
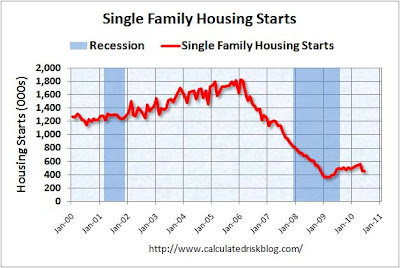
Total housing starts were at 685 thousand (SAAR) in November, up 9.3% from the revised October rate of 627 thousand (SAAR). Most of the increase this year has been for multi-family starts, but single family starts are increasing a little recently too.
Single-family starts increased 2.3% to 447 thousand in November.
Multi-family starts are increasing in 2011 - although from a very low level. This was well above expectations of 630 thousand starts in November.
Single family starts are still mostly "moving sideways".
• New Home Sales increased in November to 315,000 SAAR
 The Census Bureau reports New Home Sales in November were at a seasonally adjusted annual rate (SAAR) of 315 thousand. This was up from a revised 310 thousand in October (revised up from 307 thousand).
This graph shows New Home Sales vs. recessions since 1963. The dashed line is the current sales rate.
The next graph shows New Home Months of Supply.
 Months of supply decreased to 6.0 in November.
 The all time record was 12.1 months of supply in January 2009
This is now close to normal (less than 6 months supply is normal).
The seasonally adjusted estimate of new houses for sale at the end of November was 158,000. This represents a supply of 6.0 months at the current sales rate.
 Starting in 1973 the Census Bureau broke inventory down into three categories: Not Started, Under Construction, and Completed.
This graph shows the three categories of inventory starting in 1973.
The inventory of completed homes for sale was at 59,000 units in November. The combined total of completed and under construction is at the lowest level since this series started.
New home sales have averaged only 300 thousand SAAR over the 19 months since the expiration of the tax credit ... mostly moving sideways at a very low level ... although sales have been increasing a little lately.
• Existing Home Sales in November: 4.42 million SAAR, 7.0 months of supply
Note: this includes the downward revisions for years 2007 through 2011.
The NAR reports: Existing-Home Sales Continue to Climb in November
Total existing-home sales, which are completed transactions that include single-family, townhomes, condominiums and co-ops, increased 4.0 percent to a seasonally adjusted annual rate of 4.42 million in November from 4.25 million in October, and are 12.2 percent above the 3.94 million-unit pace in November 2010.
 This graph shows existing home sales, on a Seasonally Adjusted Annual Rate (SAAR) basis since 1993.
 Sales in November 2011 (4.42 million SAAR) were 4.0% higher than last month, and were 12.2% above the November 2010 rate.
The next graph shows the year-over-year (YoY) change in reported existing home inventory and months-of-supply. Since inventory is not seasonally adjusted, it really helps to look at the YoY change. Note: Months-of-supply is based on the seasonally adjusted sales and not seasonally adjusted inventory.
 Inventory decreased 18.1% year-over-year in November from November 2010. This is the ninth consecutive month with a YoY decrease in inventory.
Months of supply decreased to 7.0 months in November, down from 7.7 months in October. This is still a little higher than normal.
• Personal Income increased 0.1% in November, Spending increased 0.1%
 This graph shows real Personal Consumption Expenditures (PCE) through November (2005 dollars).
PCE increased 0.1% in November, and real PCE increased 0.2%.
Note: The PCE price index, excluding food and energy, increased 0.1 percent.
The personal saving rate was at 3.5% in November.
Both personal income and spending were lower than expectations. Using the "two month" method to forecast real Q4 PCE growth suggests an increase of about 2.9% in Q4. However September was especially strong (the two month method uses the first two months of a quarter), so Q4 PCE growth will probably be closer to 2.5%.
• AIA: Architecture Billings Index increased in November
 This graph shows the Architecture Billings Index since 1996. The index increased to 52.0 in November from 49.4 in October. Anything above 50 indicates expansion in demand for architects' services.
Note: This includes commercial and industrial facilities like hotels and office buildings, multi-family residential, as well as schools, hospitals and other institutions.
According to the AIA, there is an "approximate nine to twelve month lag time between architecture billings and construction spending" on non-residential construction. So this suggests further declines in CRE investment in 2012, but perhaps stabilizing later in 2012 - if this doesn't take another dip.
• Weekly Initial Unemployment Claims decline to 364,000
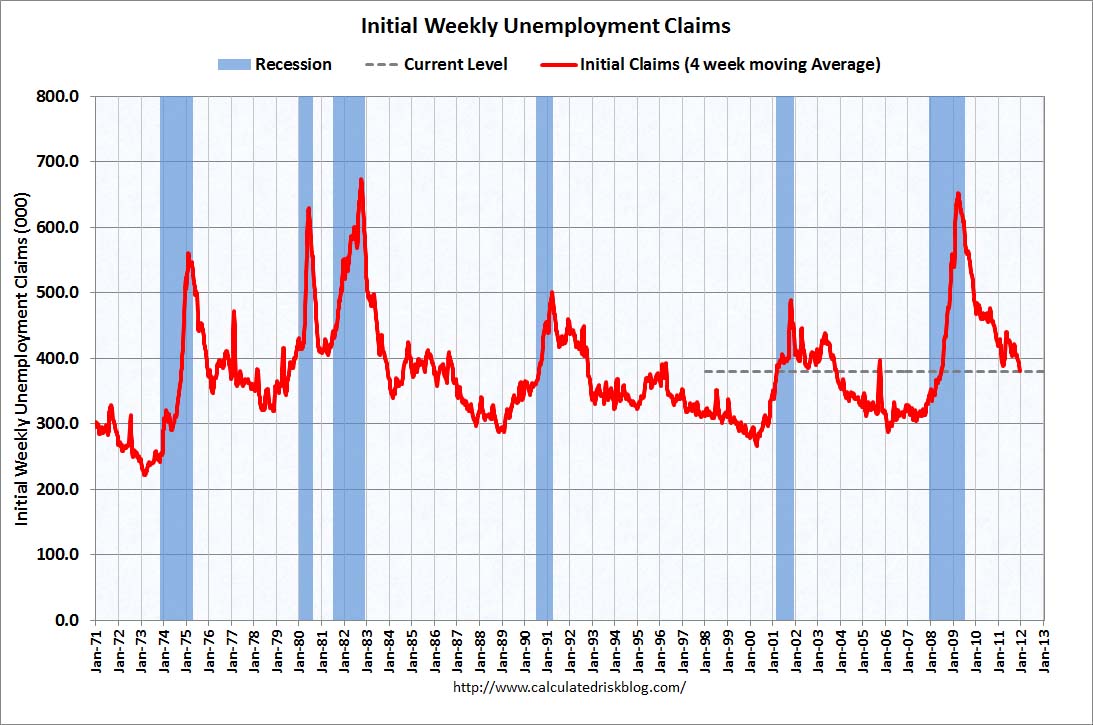
This graph shows the 4-week moving average of weekly claims since January 1971.
The dashed line on the graph is the current 4-week average. The four-week average of weekly unemployment claims decreased this week to 380,250.
This is the lowest level for weekly claims - and the lowest level for the 4-week average - since early 2008.
This survey was for the BLS reference week for the employment report, so this suggests an increase in payroll jobs in December (compared to November).
• Final December Consumer Sentiment at 69.9
 The final December Reuters / University of Michigan consumer sentiment index increased to 69.9, up from the preliminary reading of 67.7, and up from the November reading of 64.1.
Most of the recent sharp decline was event driven due to the debt ceiling debate, and sentiment has rebounded as expected. Now it is all about jobs - and gasoline prices.
Sentiment is still very weak, although above the consensus forecast of 68.0.
• Other Economic Stories ...
• NAHB Builder Confidence index increases in December
• ATA Trucking Index increased 0.3% in November
• Chicago Fed: Economic activity index declined in November
• Philly Fed State Coincident Indexes increased in November
• Residential Remodeling Index at new high in October
• Q3 2011: Mortgage Equity Withdrawal strongly negative
Friday, December 23, 2011
Unofficial Problem Bank list declines to 973 institutions
by Calculated Risk on 12/23/2011 07:25:00 PM
Note: this is an unofficial list of Problem Banks compiled only from public sources.
Here is the unofficial problem bank list for Dec 23, 2011. (table is sortable by assets, state, etc.)
Changes and comments from surferdude808:
We were only half right on anticipations this week as we accurately anticipated no closings but inaccurately anticipated the FDIC would release its formal enforcement activities for November 2011. Thus, it was a quiet week with only one removal leaving the Unofficial Problem Bank List at 973 institutions with assets of $397.6 billion. A year ago, the list held 919 institutions with assets of $407.9 billion. The removal was CapitalBank, Greenwood, SC ($629 million), which merged on an unassisted basis with Park Sterling Bank, Charlotte, NC.Earlier on November Home Sales:
• New Home Sales increase in November to 315,000 SAAR
• Home Sales: Distressing Gap
• New Home Sales graphs


