by Calculated Risk on 1/27/2010 10:00:00 AM
Wednesday, January 27, 2010
New Home Sales Decline Sharply in December
The Census Bureau reports New Home Sales in December were at a seasonally adjusted annual rate (SAAR) of 342 thousand. This is a sharp decrease from the revised rate of 370 thousand in November (revised from 355 thousand). Click on graph for larger image in new window.
The first graph shows monthly new home sales (NSA - Not Seasonally Adjusted).
Note the Red columns for 2009. In December 2009, a record low 23 thousand new homes were sold (NSA); this ties the previous record low set in December 1966.
Sales in December 2008 were at 26 thousand.  The second graph shows New Home Sales vs. recessions for the last 45 years. New Home sales fell off a cliff, but after increasing slightly, are now only 4% above the low in January.
Sales of new one-family houses in December 2009 were at a seasonally adjusted annual rate of 342,000 ... This is 7.6 percent (±14.6%)* below the revised November rate of 370,000 and is 8.6 percent (±15.2%)* below the December 2008 estimate of 374,000.And another long term graph - this one for New Home Months of Supply.
 There were 8.1 months of supply in December. Rising, but still significantly below the all time record of 12.4 months of supply set in January.
The seasonally adjusted estimate of new houses for sale at the end of December was 231,000. This represents a supply of 8.1 months at the current sales rate.
 The final graph shows new home inventory.
 Note that new home inventory does not include many condos (especially high rise condos), and areas with significant condo construction will have much higher inventory levels.
Months-of-supply and inventory have both peaked for this cycle, and sales might have bottomed too. New home sales are far more important for the economy than existing home sales, and new home sales will remain under pressure until the overhang of excess housing inventory declines much further.
Obviously this is another very weak report. I expect the Fed will change their statement on housing today. I'll have more later ...
Wednesday, December 23, 2009
New Home Sales Decrease Sharply in November
by Calculated Risk on 12/23/2009 10:00:00 AM
The Census Bureau reports New Home Sales in November were at a seasonally adjusted annual rate (SAAR) of 355 thousand. This is a sharp decrease from the revised rate of 400 thousand in October (revised down from 430 thousand).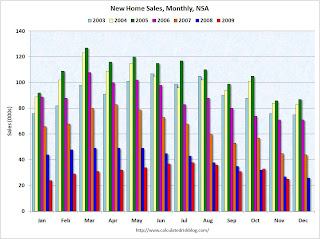 Click on graph for larger image in new window.
The first graph shows monthly new home sales (NSA - Not Seasonally Adjusted).
Note the Red columns for 2009. In November 2009, a record low 25 thousand new homes were sold (NSA); the previous record low was 26 thousand in November 1966.
Sales in November 2009 were below November 2008 (27 thousand). 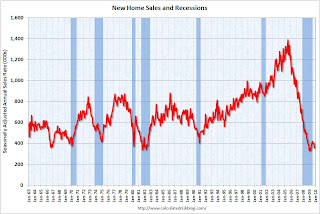 The second graph shows New Home Sales vs. recessions for the last 45 years. New Home sales fell off a cliff, but after increasing slightly, are now only 8% above the low in January.
Sales of new one-family houses in November 2009 were at a seasonally adjusted annual rate of 355,000 ... This is 11.3 percent (±11.0%) below the revised October rate of 400,000 and is 9.0 percent (±15.3%)* below the November 2008 estimate of 390,000.And another long term graph - this one for New Home Months of Supply.
 There were 7.9 months of supply in November - significantly below the all time record of 12.4 months of supply set in January.
The seasonally adjusted estimate of new houses for sale at the end of November was 235,000. This represents a supply of 7.9 months at the current sales rate.
 The final graph shows new home inventory.
 Note that new home inventory does not include many condos (especially high rise condos), and areas with significant condo construction will have much higher inventory levels.
Months-of-supply and inventory have both peaked for this cycle, and sales have probably bottomed too. New home sales are far more important for the economy than existing home sales, and new home sales will remain under pressure until the overhang of existing housing inventory declines much further.
Obviously this is a very weak report. I'll have more later ...
Wednesday, November 25, 2009
New Home Sales in October
by Calculated Risk on 11/25/2009 10:00:00 AM
The Census Bureau reports New Home Sales in October were at a seasonally adjusted annual rate (SAAR) of 430 thousand. This is an increase from the revised rate of 405 thousand in September (revised from 402 thousand). Click on graph for larger image in new window.
The first graph shows monthly new home sales (NSA - Not Seasonally Adjusted).
Note the Red columns for 2009. In October 2009, 35 thousand new homes were sold (NSA); the record low was 29 thousand in October 1981; the record high for October was 105 thousand in 2005. This is the 6th lowest sales for October since the Census Bureau started tracking sales in 1963.
Sales in October 2009 were above October 2008 (32 thousand). This is the first year over same month increase since October 2005. The second graph shows New Home Sales vs. recessions for the last 45 years. New Home sales fell off a cliff, but are now 31% above the low in January.
Sales of new one-family houses in October 2009 were at a seasonally adjusted annual rate of 430,000 ... This is 6.2 percent (±17.6%) above the revised September rate of 405,000 and is 5.1 percent (±14.9%) above the October 2008 estimate of 409,000.And another long term graph - this one for New Home Months of Supply.
 There were 6.7 months of supply in October - significantly below the all time record of 12.4 months of supply set in January.
The seasonally adjusted estimate of new houses for sale at the end of October was 239,000. This represents a supply of 6.7 months at the current sales rate.
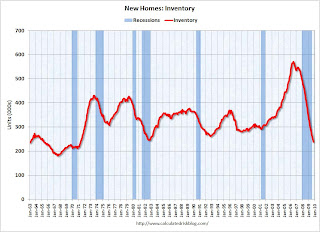 The final graph shows new home inventory.
 Note that new home inventory does not include many condos (especially high rise condos), and areas with significant condo construction will have much higher inventory levels.
Months-of-supply and inventory have both peaked for this cycle, and sales have probably bottomed too. New home sales are far more important for the economy than existing home sales, and new home sales will remain under pressure until the overhang of existing housing inventory declines much further.
I'll have more later ...
Wednesday, October 28, 2009
New Home Sales Decrease in September
by Calculated Risk on 10/28/2009 10:00:00 AM
The Census Bureau reports New Home Sales in September were at a seasonally adjusted annual rate (SAAR) of 402 thousand. This is a decrease from the revised rate of 417 thousand in August (revised from 429 thousand). Click on graph for larger image in new window.
The first graph shows monthly new home sales (NSA - Not Seasonally Adjusted).
Note the Red columns for 2009. Sales in September 2009 (31 thousand) were below September 2008 (35 thousand). This is the 3rd lowest sales for September since the Census Bureau started tracking sales in 1963.
In September 2009, 31 thousand new homes were sold (NSA); the record low was 28 thousand in September 1981; the record high for September was 99 thousand in 2005. The second graph shows New Home Sales vs. recessions for the last 45 years. New Home sales fell off a cliff, but are now 22% above the low in January.
Sales of new one-family houses in September 2009 were at a seasonally adjusted annual rate of 402,000 ...And another long term graph - this one for New Home Months of Supply.
This is 3.6 percent (±10.2%)* below the revised August rate of 417,000 and is 7.8 percent (±12.0%)* below the September 2008 estimate of 436,000.
 There were 7.5 months of supply in September - significantly below the all time record of 12.4 months of supply set in January.
The seasonally adjusted estimate of new houses for sale at the end of September was 251,000. This represents a supply of 7.5 months at the current sales rate.
 The final graph shows new home inventory.
 Note that new home inventory does not include many condos (especially high rise condos), and areas with significant condo construction will have much higher inventory levels.
Months-of-supply and inventory have both peaked for this cycle, and new homes sales has probably also bottomed for this cycle. Sales were probably impacted by the end of the first-time home buyer tax credit (because of timing, new home sales are impacted before existing home sales).
New home sales are far more important for the economy than existing home sales, and new home sales will remain under pressure until the overhang of existing homes declines much further.
I'll have more later ...
Friday, September 25, 2009
New Home Sales Flat in August
by Calculated Risk on 9/25/2009 10:00:00 AM
The Census Bureau reports New Home Sales in August were at a seasonally adjusted annual rate (SAAR) of 429 thousand. This is a slight increase from the revised rate of 426 thousand in July (revised from 433 thousand). Click on graph for larger image in new window.
The first graph shows monthly new home sales (NSA - Not Seasonally Adjusted).
Note the Red columns for 2009. Sales in August 2009 were the same as August 2008. This is the 4th lowest sales for August since the Census Bureau started tracking sales in 1963.
In August 2009, 38 thousand new homes were sold (NSA); the record low was 34 thousand in August 1981; the record high for August was 110 thousand in 2005.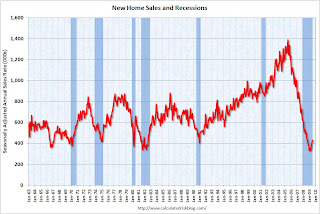 The second graph shows New Home Sales vs. recessions for the last 45 years. New Home sales fell off a cliff, but are now 30% above the low in January.
Sales of new one-family houses in August 2009 were at a seasonally adjusted annual rate of 429,000 ...And another long term graph - this one for New Home Months of Supply.
This is 0.7 percent (±16.2%)* above the revised July rate of 426,000, but is 3.4 percent (±13.3%) below the August 2008 estimate of 444,000.
 There were 7.3 months of supply in August - significantly below the all time record of 12.4 months of supply set in January.
The seasonally adjusted estimate of new houses for sale at the end of August was 262,000. This represents a supply of 7.3 months at the current sales rate.
 The final graph shows new home inventory.
 Note that new home inventory does not include many condos (especially high rise condos), and areas with significant condo construction will have much higher inventory levels.
Months-of-supply and inventory have both peaked for this cycle, and new homes sales has probably also bottomed for this cycle. However any further recovery in sales will likely be modest because of the huge overhang of existing homes for sale.
I'll have more later ...
Wednesday, August 26, 2009
New Home Sales Increase in July
by Calculated Risk on 8/26/2009 10:00:00 AM
The Census Bureau reports New Home Sales in July were at a seasonally adjusted annual rate (SAAR) of 433 thousand. This is an increase from the revised rate of 395 thousand in June. Click on graph for larger image in new window.
The first graph shows monthly new home sales (NSA - Not Seasonally Adjusted).
Note the Red columns for 2009. This is the 3rd lowest sales for July since the Census Bureau started tracking sales in 1963.
In July 2009, 39 thousand new homes were sold (NSA); the record low was 31 thousand in July 1982; the record high for July was 117 thousand in 2005.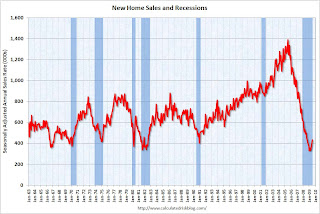 The second graph shows New Home Sales vs. recessions for the last 45 years. New Home sales fell off a cliff, but are now 32% above the low in January.
Sales of new one-family houses in July 2009 were at a seasonally adjusted annual rate of 433,000 ...And another long term graph - this one for New Home Months of Supply.
This is 9.6 percent (±13.4%) above the revised June rate of 395,000, but is 13.4 percent (±12.9%) below the July 2008 estimate of 500,000.
 There were 7.5 months of supply in July - significantly below the all time record of 12.4 months of supply set in January.
The seasonally adjusted estimate of new houses for sale at the end of July was 271,000. This represents a supply of 7.5months at the current sales rate..
 The final graph shows new home inventory.
 Note that new home inventory does not include many condos (especially high rise condos), and areas with significant condo construction will have much higher inventory levels.
Months-of-supply and inventory have both peaked for this cycle, and there is a good chance that sales of new homes has also bottomed for this cycle. However any further recovery in sales will likely be modest because of the huge overhang of existing homes for sale.
I'll have more later ...
Monday, July 27, 2009
New Home Sales increase in June, Highest since November 2008
by Calculated Risk on 7/27/2009 10:00:00 AM
The Census Bureau reports New Home Sales in June were at a seasonally adjusted annual rate (SAAR) of 384 thousand. This is an increase from the revised rate of 345 thousand in May. Click on graph for larger image in new window.
The first graph shows monthly new home sales (NSA - Not Seasonally Adjusted).
Note the Red columns for 2009. This is the 2nd lowest sales for June since the Census Bureau started tracking sales in 1963.
In June 2009, 36 thousand new homes were sold (NSA); the record low was 34 thousand in June 1982; the record high for June was 115 thousand in 2005. The second graph shows New Home Sales vs. recessions for the last 45 years. New Home sales have fallen off a cliff.
Sales of new one-family houses in June 2009 were at a seasonally adjusted annual rate of 384,000 ...And another long term graph - this one for New Home Months of Supply.
This is 11.0 percent (±13.2%)* above the revised May rate of 346,000, but is 21.3 percent (±11.4%) below the June 2008 estimate of 488,000.
 There were 8.8 months of supply in June - significantly below the all time record of 12.4 months of supply set in January.
The seasonally adjusted estimate of new houses for sale at the end of June was 281,000. This represents a supply of 8.8 months at the current sales rate.
 The final graph shows new home inventory.
 Note that new home inventory does not include many condos (especially high rise condos), and areas with significant condo construction will have much higher inventory levels.
Months-of-supply for inventory has peaked, and there is some chance that sales of new homes has bottomed for this cycle - but we won't know for many months. However any recovery in sales will likely be modest because of the huge overhang of existing homes for sale.
I'll have more later ...
Wednesday, June 24, 2009
New Home Sales: Record Low for May
by Calculated Risk on 6/24/2009 10:00:00 AM
The Census Bureau reports New Home Sales in May were at a seasonally adjusted annual rate (SAAR) of 342 thousand. This is essentially the same as the revised rate of 344 thousand in April. Click on graph for larger image in new window.
The first graph shows monthly new home sales (NSA - Not Seasonally Adjusted).
Note the Red columns for 2009. This is the lowest sales for May since the Census Bureau started tracking sales in 1963. (NSA, 32 thousand new homes were sold in May 2009; the record low was 36 thousand in May 1982).
As the graph indicates, sales in May 2009 were substantially worse than the previous years. The second graph shows New Home Sales vs. recessions for the last 45 years. New Home sales have fallen off a cliff.
Sales of new one-family houses in May 2009 were at a seasonally adjusted annual rate of 342,000 ...And another long term graph - this one for New Home Months of Supply.
This is 0.6 percent (±17.8%)* below the revised April rate of 344,000 and is 32.8 percent (±10.9%) below the May 2008 estimate of 509,000..
 There were 10.2 months of supply in May - significantly below the all time record of 12.4 months of supply set in January.
The seasonally adjusted estimate of new houses for sale at the end of May was 292,000. This represents a supply of 10.2 months at the current sales rate.
 The final graph shows new home inventory.
 Note that new home inventory does not include many condos (especially high rise condos), and areas with significant condo construction will have much higher inventory levels.
It appears the months-of-supply for inventory has peaked, and there is some chance that sales of new homes has bottomed for this cycle - but we won't know for many months. However any recovery in sales will likely be modest because of the huge overhang of existing homes for sale.
This is another weak report. I'll have more later ...
Thursday, May 28, 2009
New Home Sales Flat in April
by Calculated Risk on 5/28/2009 10:00:00 AM
The Census Bureau reports New Home Sales in April were at a seasonally adjusted annual rate (SAAR) of 352 thousand. This is essentially the same as the revised rate of 351 thousand in March. Click on graph for larger image in new window.
The first graph shows monthly new home sales (NSA - Not Seasonally Adjusted).
Note the Red columns for 2009. This is the second lowest sales for April since the Census Bureau started tracking sales in 1963. (NSA, 33 thousand new homes were sold in March 2009; the record low was 32 thousand in April 1982).
As the graph indicates, sales in April 2009 were substantially worse than the previous years. The second graph shows New Home Sales vs. recessions for the last 45 years. New Home sales have fallen off a cliff.
Sales of new one-family houses in April 2009 were at a seasonally adjusted annual rate of 352,000, according to estimates released jointly today by the U.S. Census Bureau and the Department of Housing and Urban Development.And another long term graph - this one for New Home Months of Supply.
This is 0.3 percent (±14.5%)* above the revised March rate of 351,000, but is 34.0 percent (±11.0%) below the April 2008 estimate of 533,000.
 There were 10.1 months of supply in April - significantly below the all time record of 12.4 months of supply set in January.
The seasonally adjusted estimate of new houses for sale at the end of April was 297,000. This represents a supply of 10.1months at the current sales rate.
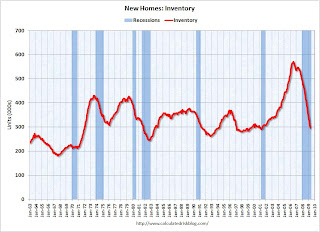 The final graph shows new home inventory.
 Note that new home inventory does not include many condos (especially high rise condos), and areas with significant condo construction will have much higher inventory levels.
It appears the months-of-supply for inventory has peaked, and there is some chance that sales of new homes has bottomed for this cycle - but we won't know for many months. However any recovery in sales will likely be modest because of the huge overhang of existing homes for sale. I'll have more ...
Friday, April 24, 2009
New Home Sales: 356 Thousand SAAR in March
by Calculated Risk on 4/24/2009 10:00:00 AM
The Census Bureau reports New Home Sales in March were at a seasonally adjusted annual rate (SAAR) of 356 thousand. This is slightly below the upwardly revised rate of 358 thousand in February. Click on graph for larger image in new window.
The first graph shows monthly new home sales (NSA - Not Seasonally Adjusted).
Note the Red columns for 2009. This is the lowest sales for March since the Census Bureau started tracking sales in 1963. (NSA, 34 thousand new homes were sold in March 2009; the previous low was 36 thousand in March 1982).
As the graph indicates, sales in March 2009 are substantially worse than the previous years. The second graph shows New Home Sales vs. recessions for the last 45 years. New Home sales have fallen off a cliff.
Sales of new one-family houses in March 2009 were at a seasonally adjusted annual rate of 356,000, according to estimates released jointly today by the U.S. Census Bureau and the Department of Housing and Urban Development.And one more long term graph - this one for New Home Months of Supply.
This is 0.6 percent (±19.0%)* below the revised February rate of 358,000 and is 30.6 percent (±10.7%) below the March 2008 estimate of 513,000.
 There were 10.7 months of supply in March - significantly below the all time record of 12.5 months of supply set in January.
The seasonally adjusted estimate of new houses for sale at the end of March was 311,000. This represents a supply of 10.7 months at the current sales rate.
 The final graph shows new home inventory.
 Note that new home inventory does not include many condos (especially high rise condos), and areas with significant condo construction will have much higher inventory levels.
Although sales were at a March record low, there are positives in this report - especially considering the upward revisions for previous months. It appears the months-of-supply has peak, and there is a reasonable chance that new home sales has bottomed for this cycle - however any recovery in sales will be modest because of the huge overhang of existing homes for sale. I'll have more soon.
Wednesday, March 25, 2009
New Home Sales: Just above Record Low
by Calculated Risk on 3/25/2009 10:00:00 AM
The Census Bureau reports New Home Sales in February were at a seasonally adjusted annual rate of 337 thousand. This is slightly above the record low of 322 thousand in January. Click on graph for larger image in new window.
The first graph shows monthly new home sales (NSA - Not Seasonally Adjusted).
Note the Red column for 2009. This is the lowest sales for February since the Census Bureau started tracking sales in 1963. (NSA, 27 thousand new homes were sold in February 2009; the previous low was 29 thousand in February 1982).
As the graph indicates, sales in February 2009 are substantially worse than the previous years. The second graph shows New Home Sales vs. recessions for the last 45 years. New Home sales have fallen off a cliff.
Sales of new one-family houses in February 2009 were at a seasonally adjusted annual rate of 337,000, according to estimates released jointly today by the U.S. Census Bureau and the Department of Housing and Urban Development.And one more long term graph - this one for New Home Months of Supply.
This is 4.7 percent (±18.3%) above the revised January rate of 322,000, but is 41.1 percent (±7.9%) below the February 2008 estimate of 572,000.
 There were 12.2 months of supply in February - just below the al time record of 12.9 months of supply set in January.
The seasonally adjusted estimate of new houses for sale at the end of February was 330,000. This represents a supply of 12.2 months at the current sales rate.
 Update: Corrected Y-Axis label.
 The final graph shows new home inventory. For new homes, both sales and inventory are falling quickly - since starts have fallen off a cliff.
Note that new home inventory does not include many condos (especially high rise condos), and areas with significant condo construction will have much higher inventory levels.
This is a another extremely weak report. Even with the small increase in sales, sales are near record lows. And months of supply is also just off the record high. I'll have more on new home sales later today ...
Thursday, February 26, 2009
Record Low New Home Sales in January
by Calculated Risk on 2/26/2009 10:00:00 AM
The Census Bureau reports New Home Sales in January were at a seasonally adjusted annual rate of 309 thousand. This is the lowest sales rate the Census Bureau has ever recorded (starting in 1963).  Click on graph for larger image in new window.
The first graph shows monthly new home sales (NSA - Not Seasonally Adjusted).
Note the Red column for January 2009. This is the lowest sales for January since the Census Bureau started tracking sales in 1963. (NSA, 23 thousand new homes were sold in January 2009).
As the graph indicates, sales in January 2009 are substantially worse than the previous years. The second graph shows New Home Sales vs. recessions for the last 45 years. New Home sales have fallen off a cliff.
Sales of new one-family houses in January 2009 were at a seasonally adjusted annual rate of 309,000, according to estimates released jointly today by the U.S. Census Bureau and the Department of Housing and Urban Development.And one more long term graph - this one for New Home Months of Supply.
This is 10.2 percent (±15.4%)* below the revised December rate of 344,000 and is 48.2 percent (±6.8%) below the January 2008 estimate of 597,000.
 The months of supply is at an ALL TIME RECORD 13.3 months in January (this is seasonally adjusted)!
The seasonally adjusted estimate of new houses for sale at the end of January was 342,000. This represents a supply of 13.3 months at the current sales rate.
 The final graph shows new home inventory. For new homes, both sales and inventory are falling quickly - since starts have fallen off a cliff.
Note that new home inventory does not include many condos (especially high rise condos), and areas with significant condo construction will have much higher inventory levels.
This is a another extremely weak report. Record low sales. Record high months of supply. More Cliff Diving. I'll have more on new home sales later today ...
Thursday, January 29, 2009
Record Low New Homes Sales in December
by Calculated Risk on 1/29/2009 10:00:00 AM
The Census Bureau reports, New Home Sales in December were at a seasonally adjusted annual rate of 331 thousand. This is the lowest sales rate the Census Bureau has ever recorded (starting in 1963).  Click on graph for larger image in new window.
The first graph shows monthly new home sales (NSA - Not Seasonally Adjusted).
Notice the Red columns for 2008. This is the lowest sales for December since 1966. (NSA, 23 thousand new homes were sold in December 2008, 23 thousand were sold in December 1966).
As the graph indicates, sales in 2008 are substantially worse than the previous years. The second graph shows New Home Sales vs. recessions for the last 45 years. New Home sales have fallen off a cliff.
Sales of new one-family houses in December 2008 were at a seasonally adjusted annual rate of 331,000, according to estimates released jointly today by the U.S. Census Bureau and the Department of Housing and Urban Development.And one more long term graph - this one for New Home Months of Supply.
This is 14.7 percent (±13.9%)* below the revised November of 388,000 and is 44.8 percent (±10.8%) below the December 2007 estimate of 600,000.
 The months of supply is at an ALL TIME RECORD 12.9 months in December (this is seasonally adjusted)!
The seasonally adjusted estimate of new houses for sale at the end of December was 357,000. This represents a supply of 12.9 months at the current sales rate.
 The final graph shows new home inventory. For new homes, both sales and inventory are falling quickly since starts have fallen off a cliff.
Note that new home inventory does not include many condos (especially high rise condos), and areas with significant condo construction will have much higher inventory levels.
This is a another very weak report. Record low sales. Record high months of supply. Ouch. I'll have more on new home sales later today ...


